Once you have an Easy Insight account, you can create a connection to LOCATE Inventory through the Connections page. Click on the LOCATE Inventory connection. You'll need to put in the endpoint for your LOCATE Inventory and the API key. To get an API key, navigate to LOCATE and click on Setup > Users. Click on the “New User” button in the top right of the table. Enter a First Name and Last Name to identify the the account. Select “API” from the User Type drop down. Enter an Email Address and click “Save”. You will be presented with the new user’s details and most importantly their “API Key”. Enter this API Key into Easy Insight. You do not need to enter a username/password if using an API key (the preferred configuration).
When you first install your connection to LOCATE Inventory in Easy Insight, you'll get a prebuilt dashboard with a variety of reports to help you get started. You can customize any of these reports or replace them with your own.
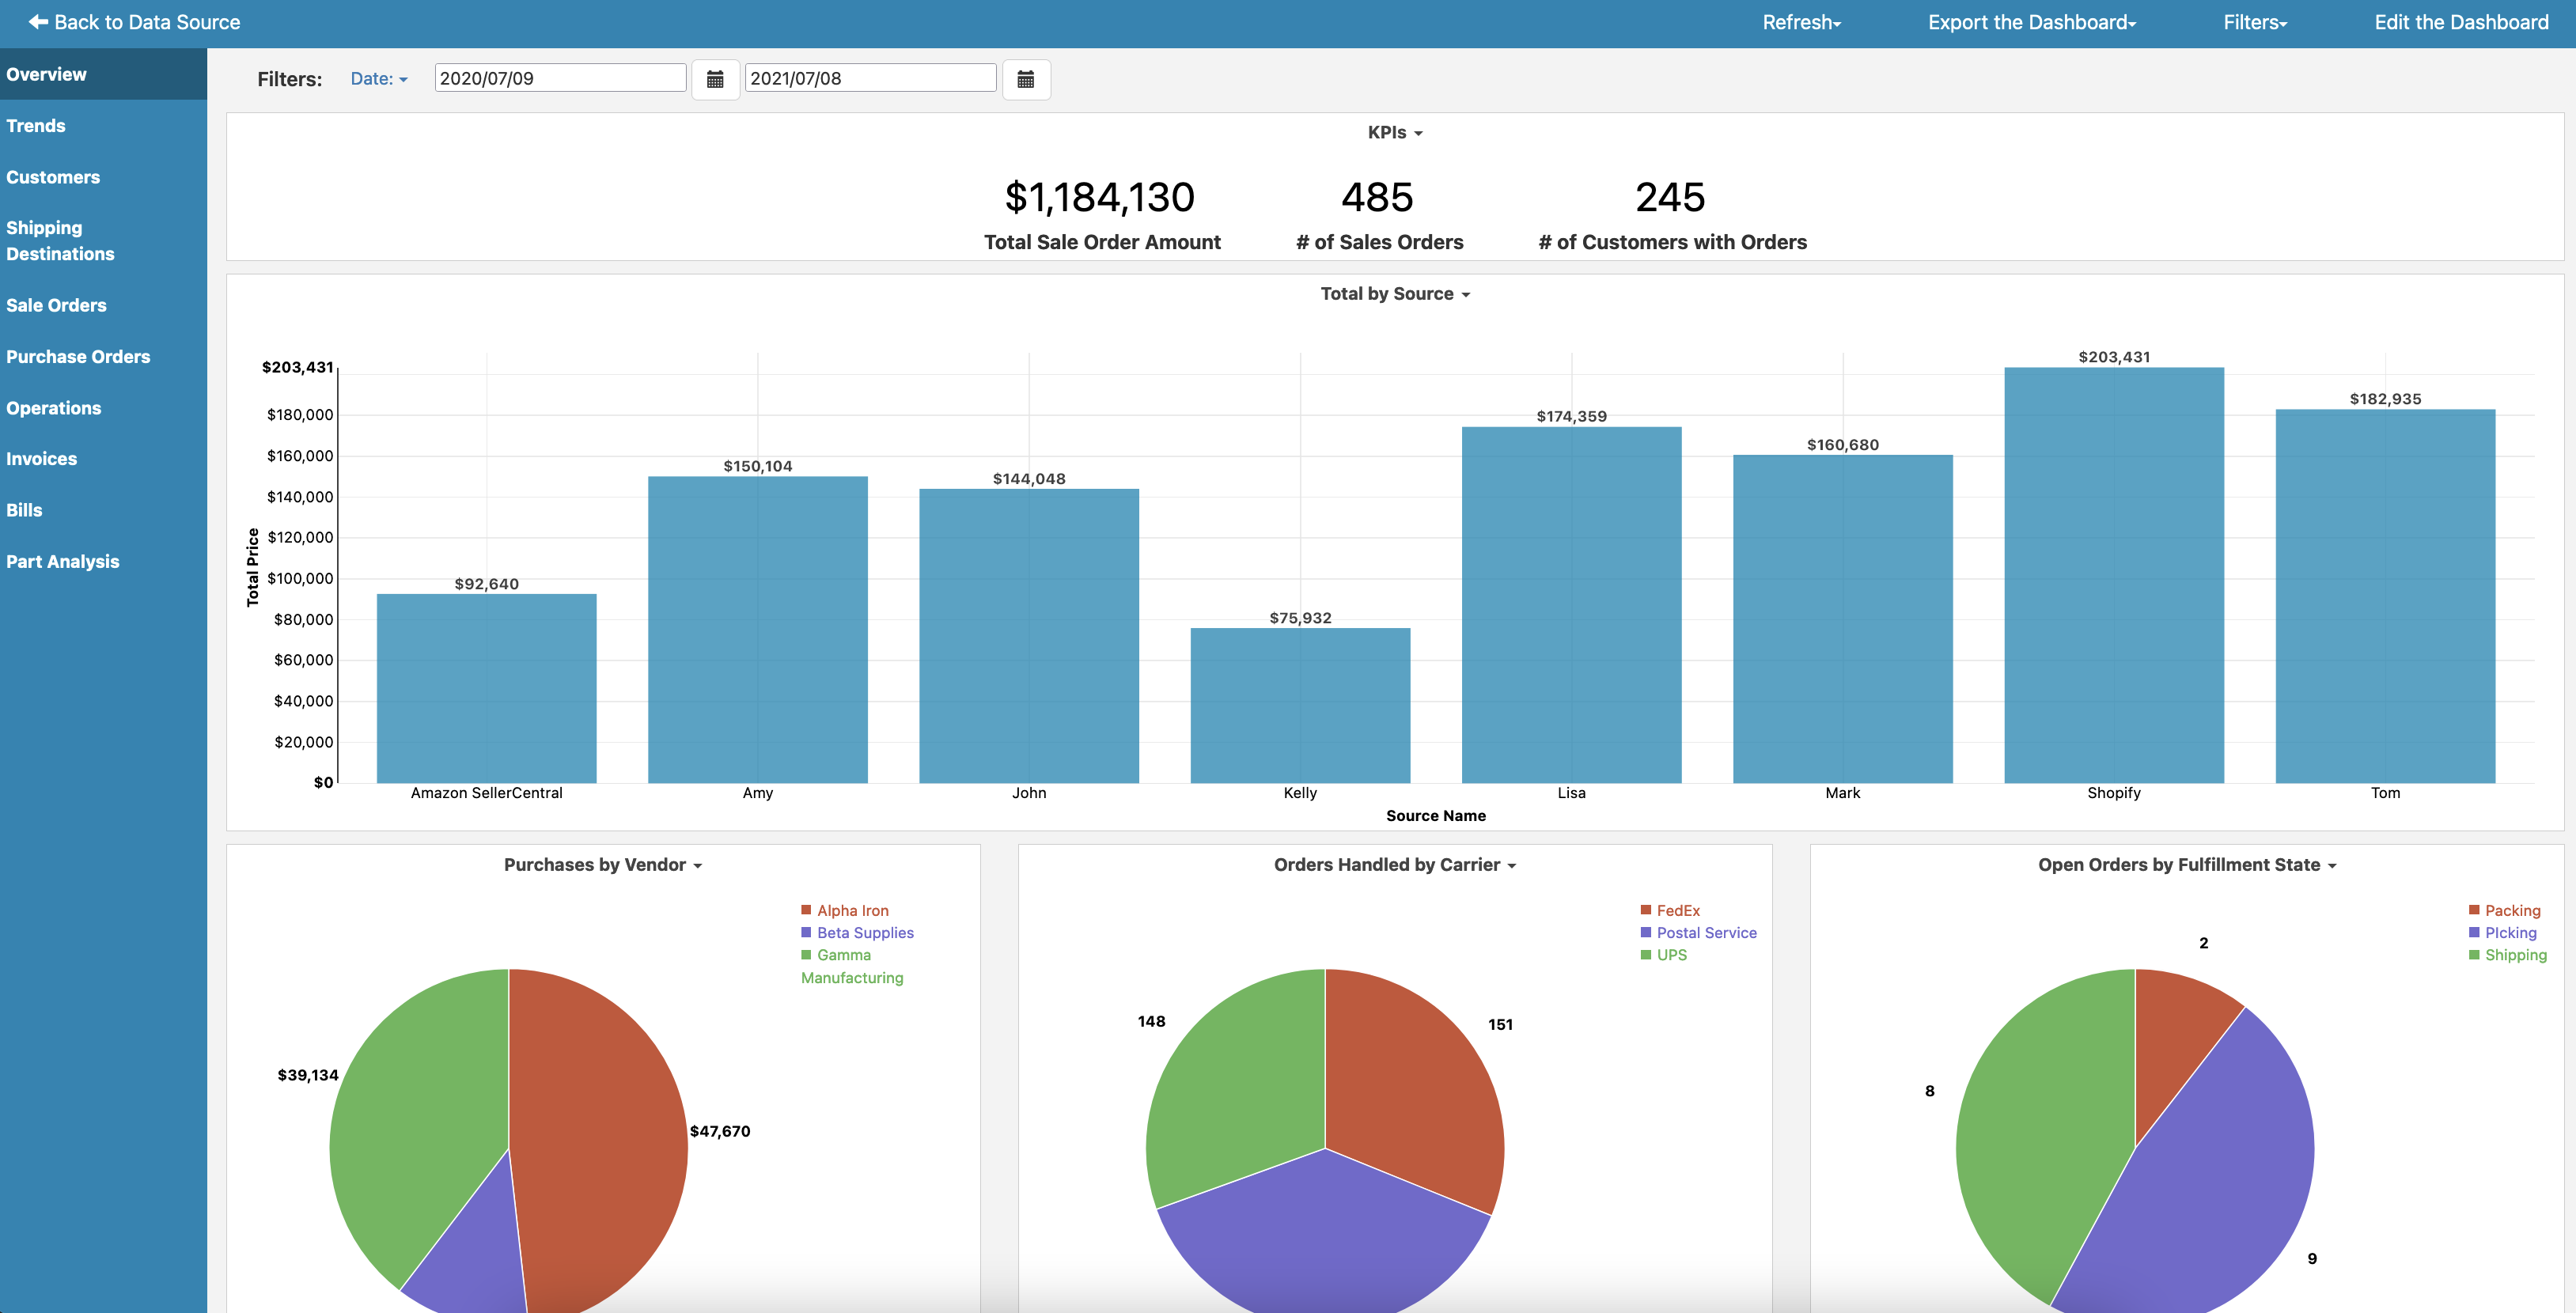
The overview provides you with a summary view across your system, covering sales, purchases, invoices, and shipments.
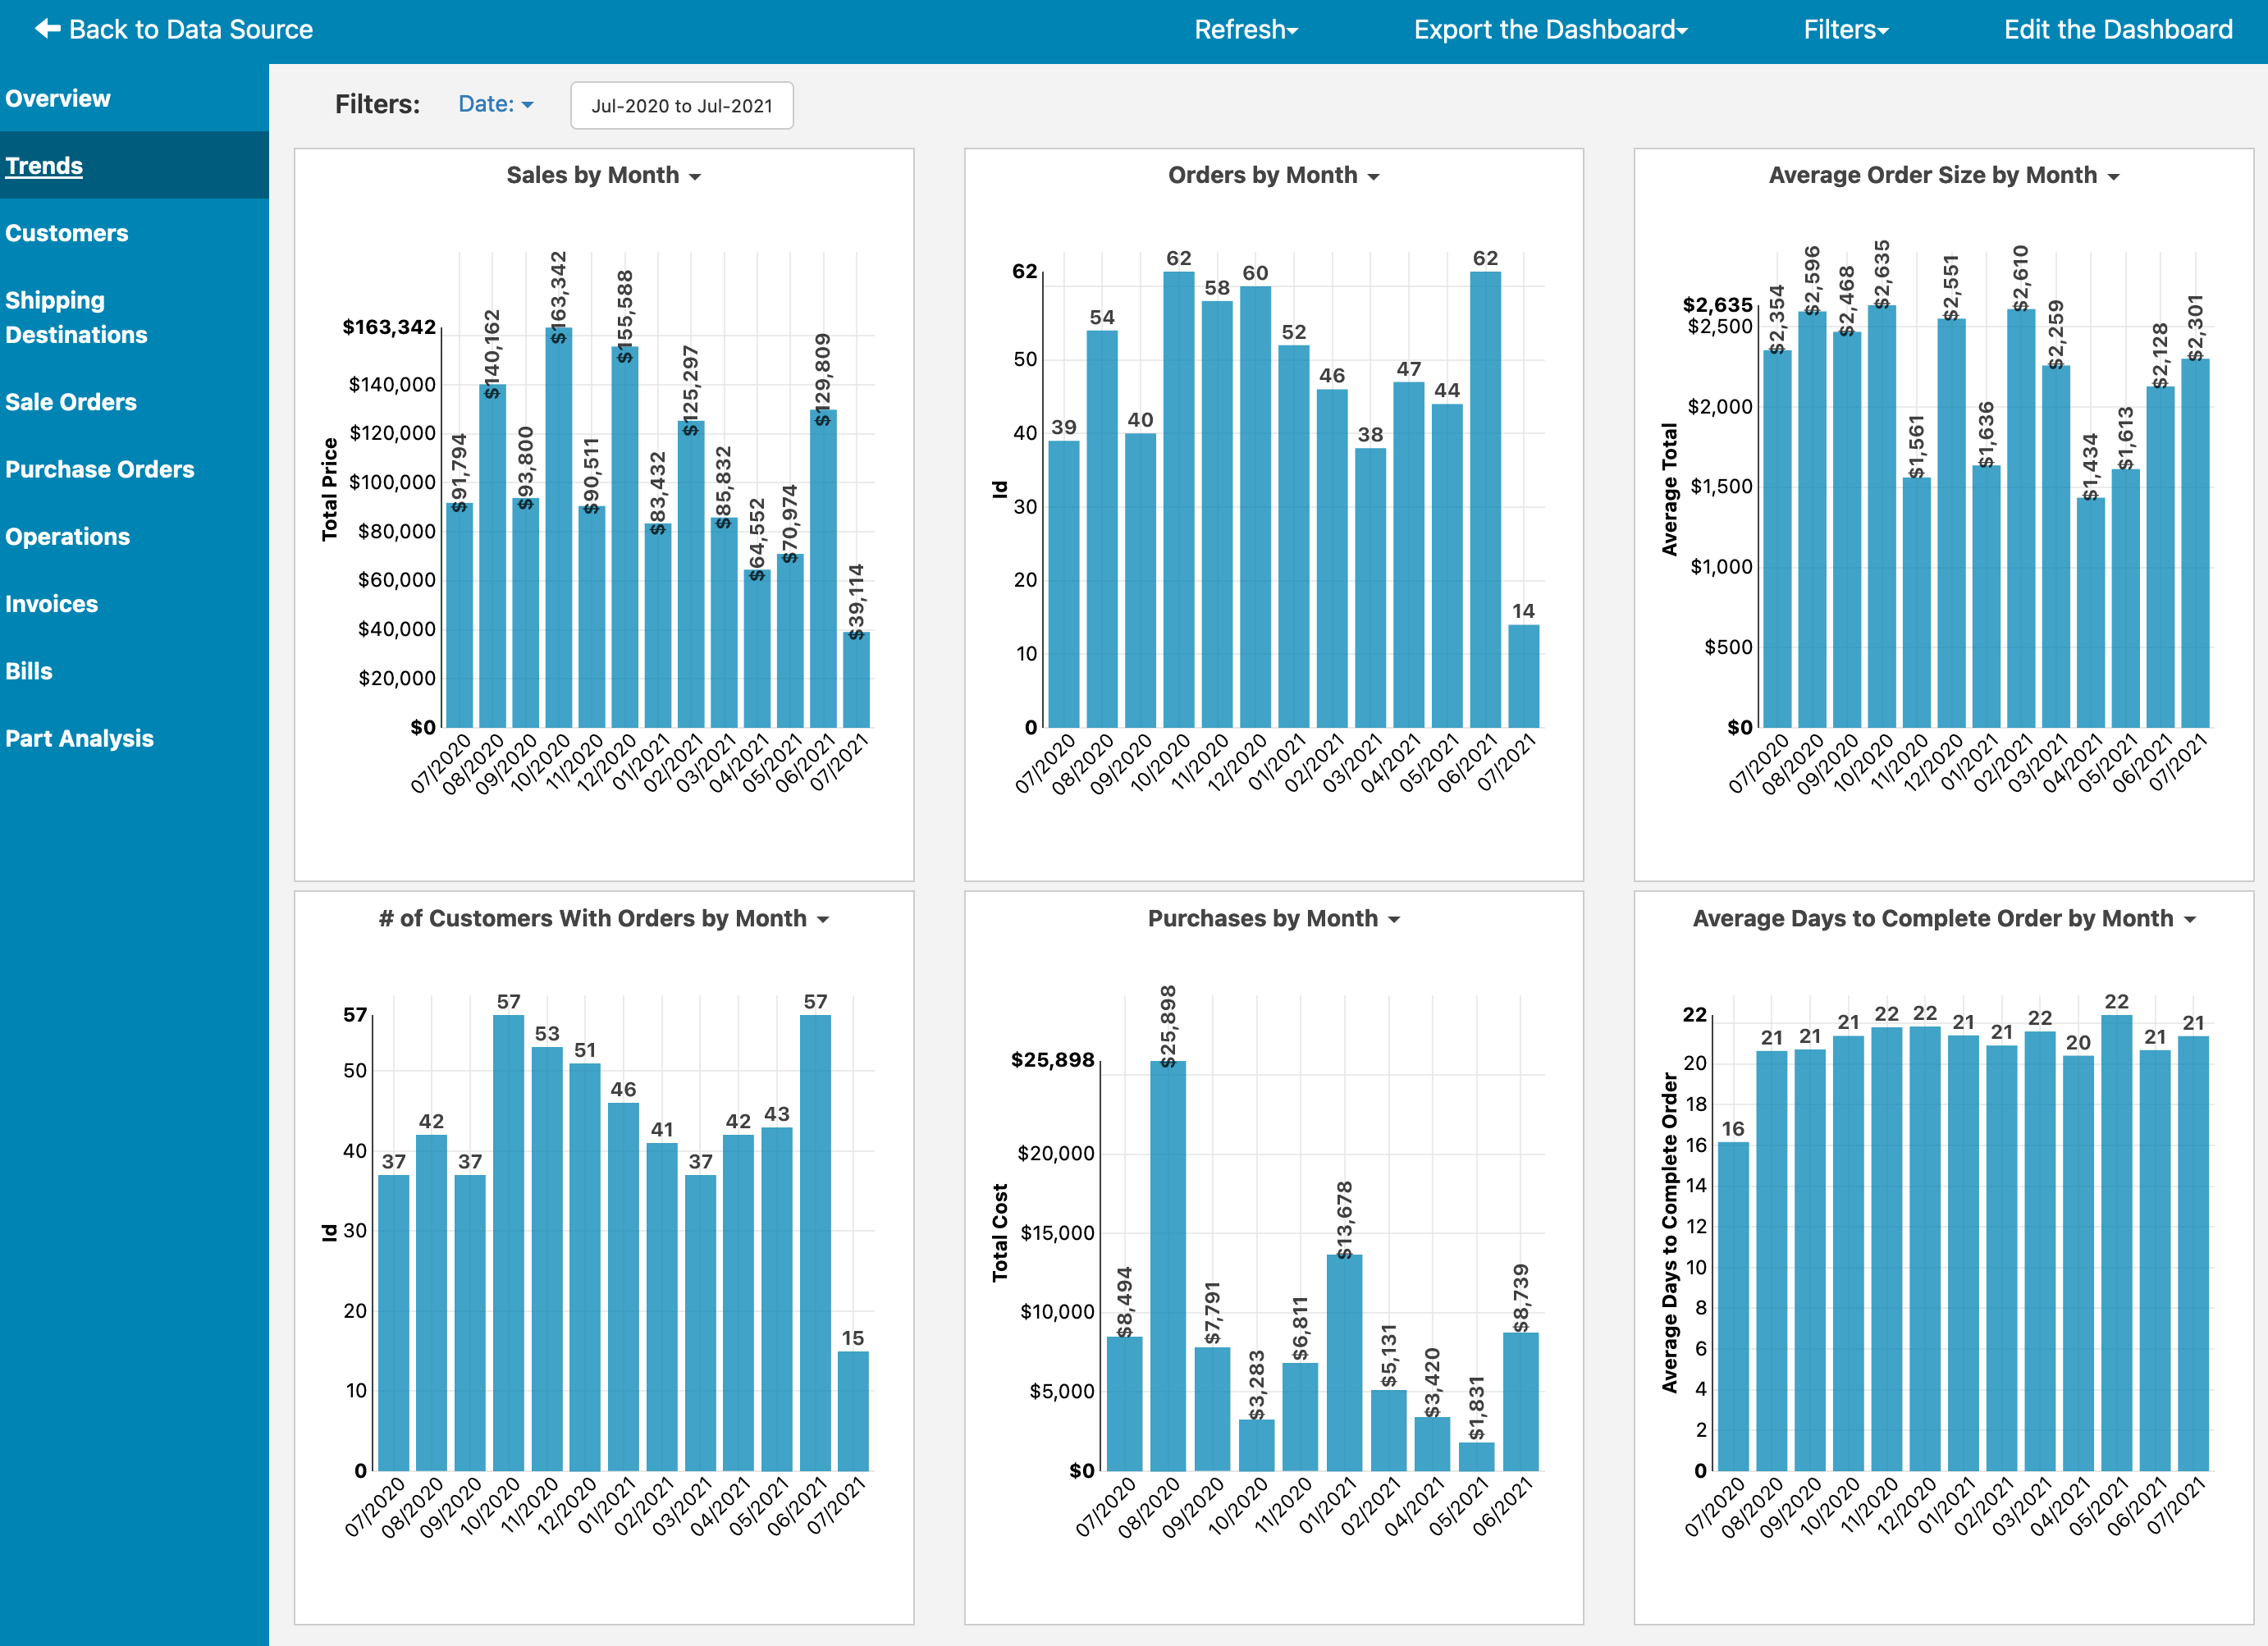
Trends help you understand historical performance of your sales and invoices.
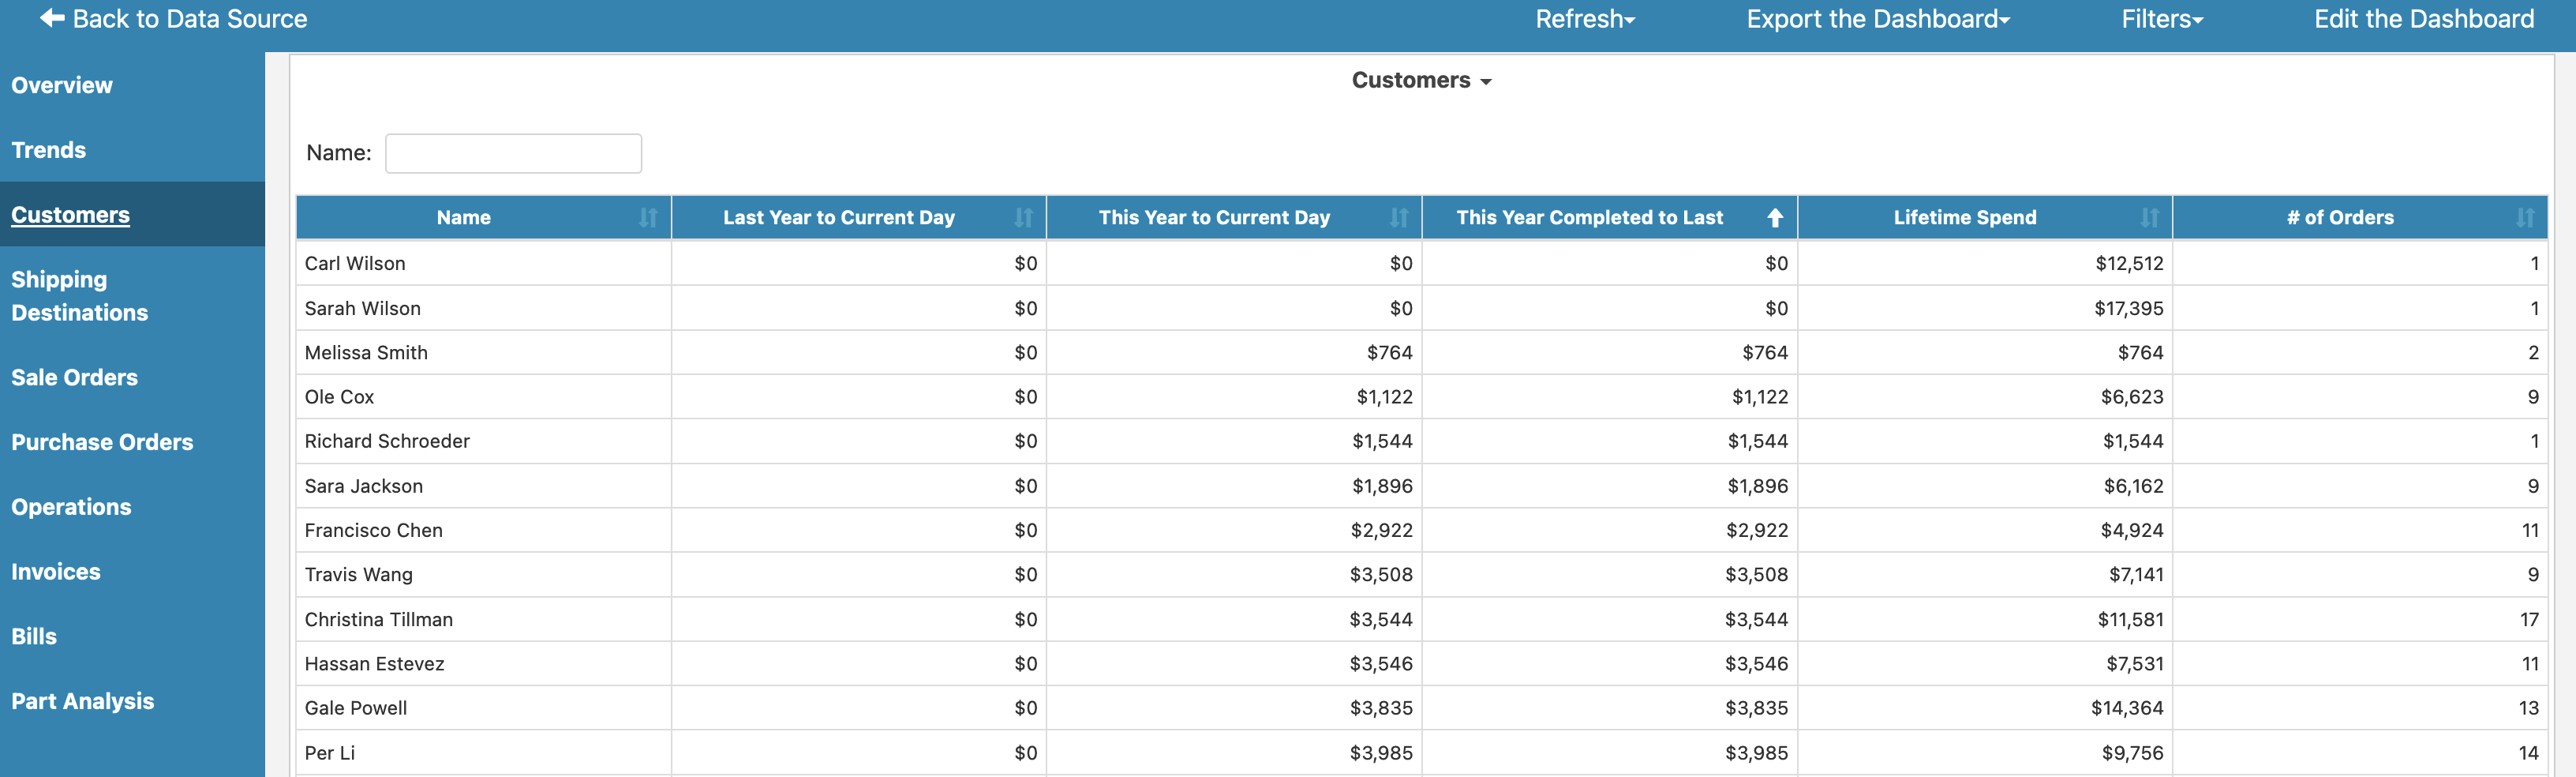
The Customers tab shows you customers with lifetime customer value (LCV) and year over year change in order amounts.
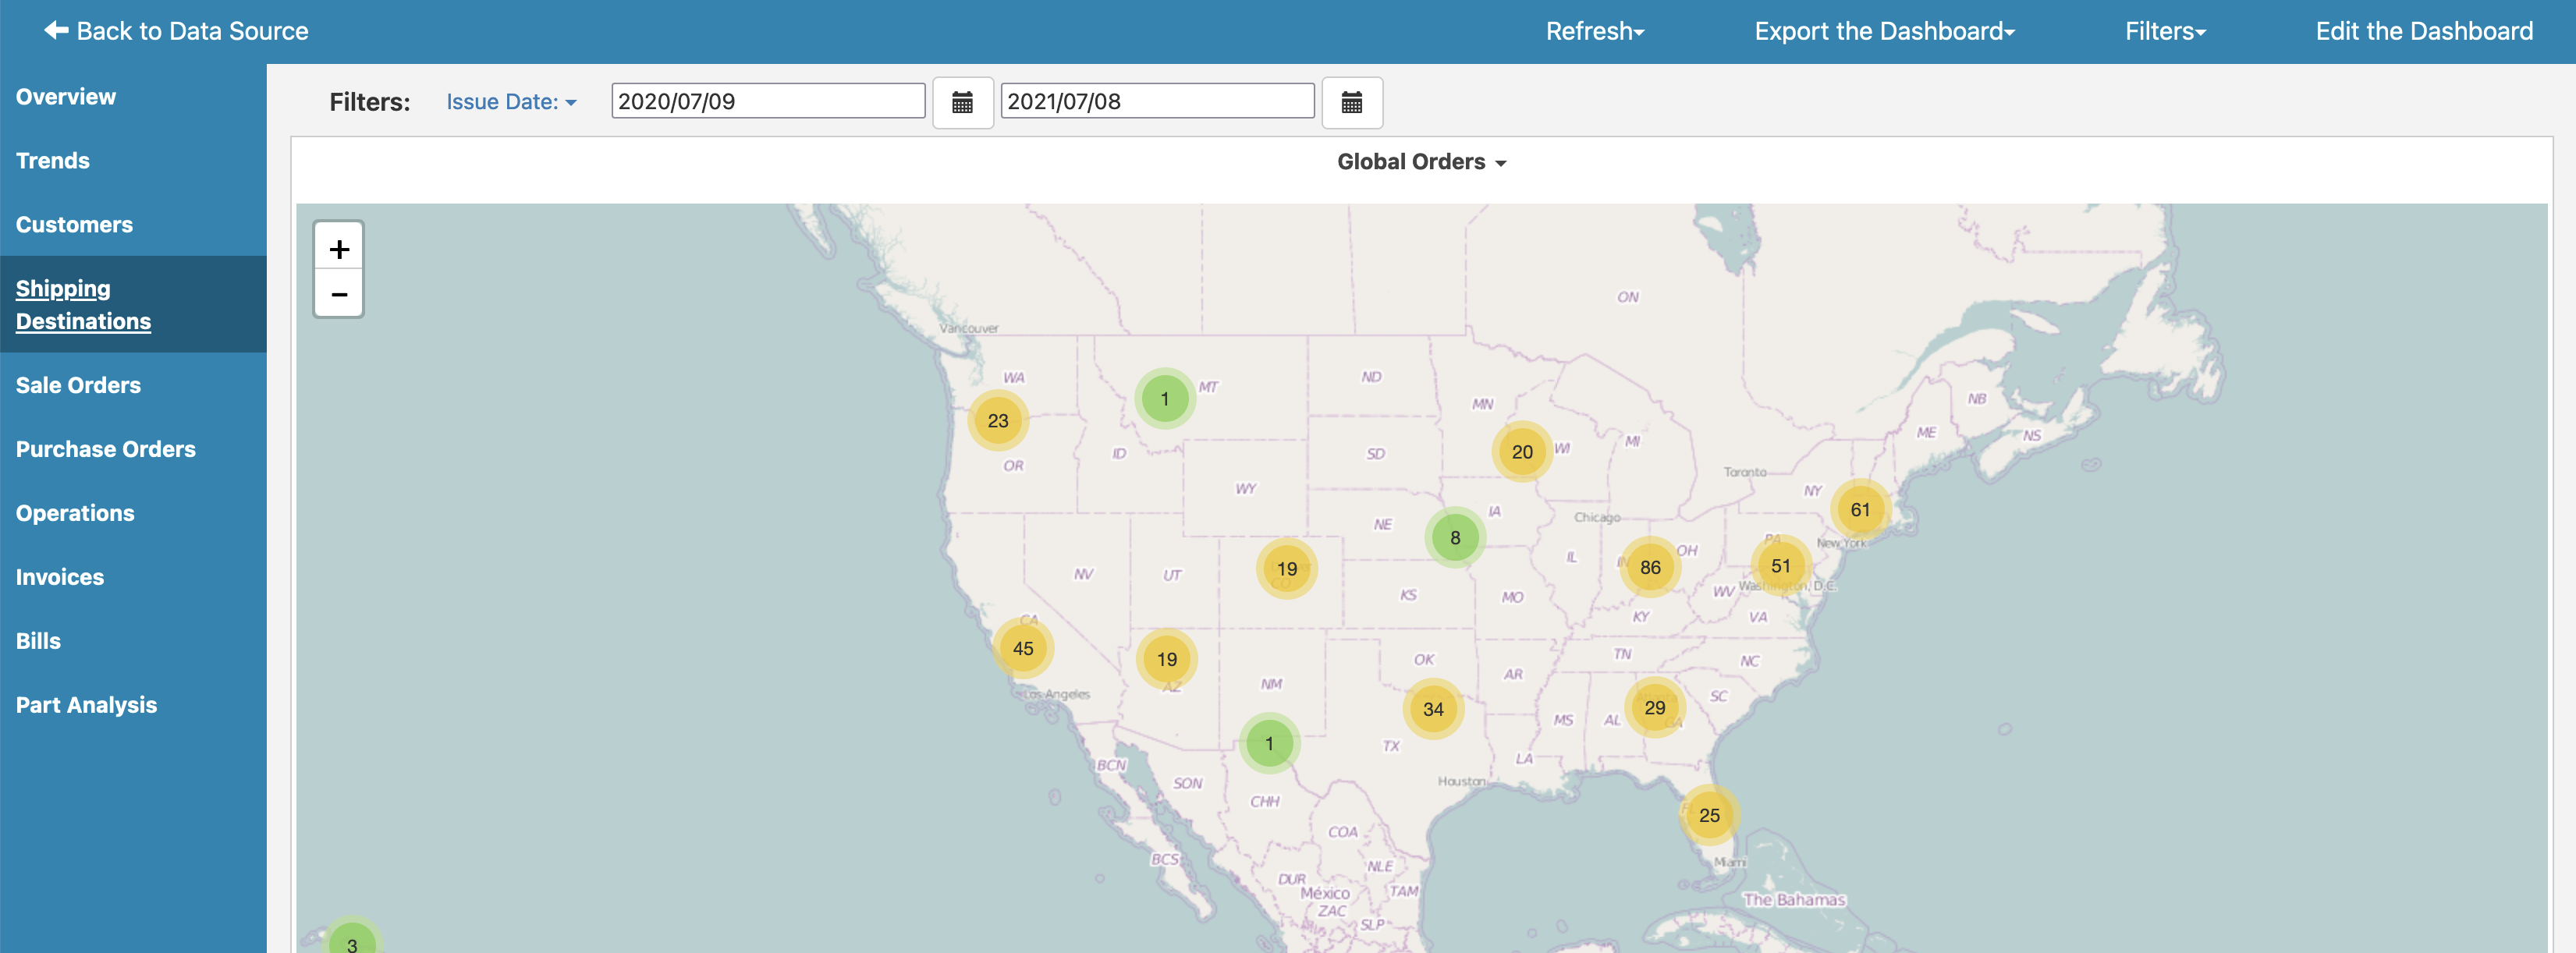
The Shipping Destinations tab shows where your orders are shipping.
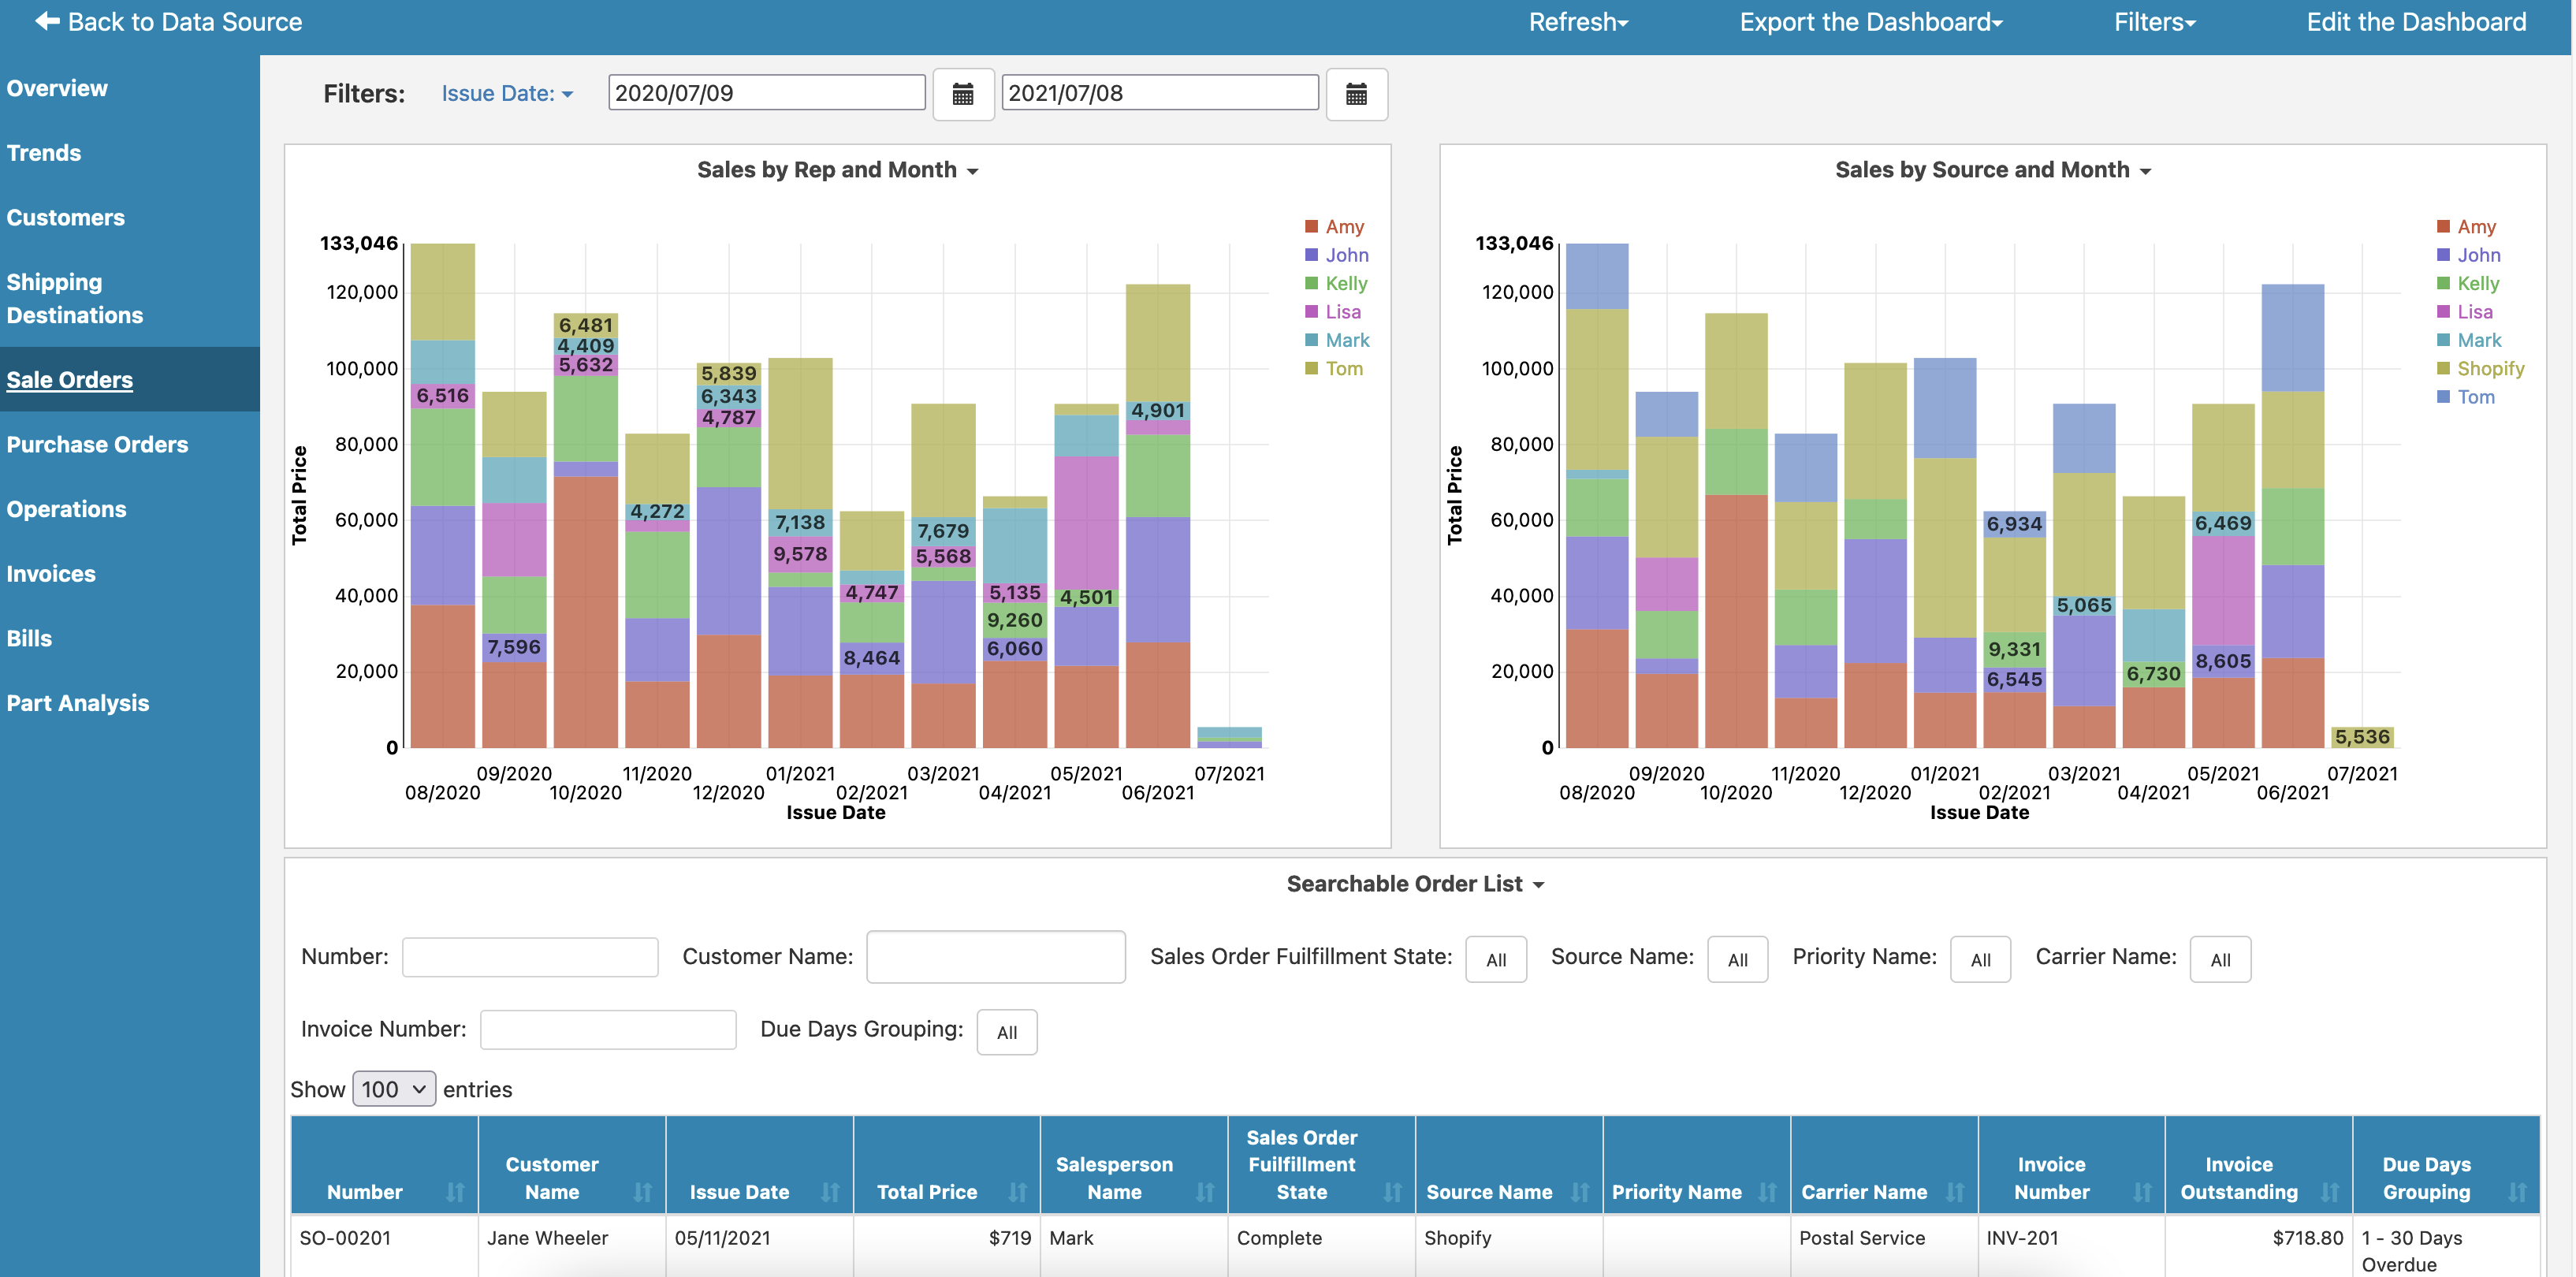
The Sales tab gives you reports on sales amounts by rep and month and sales by source and month, as well as a searchable table of sales by a variety of filters.
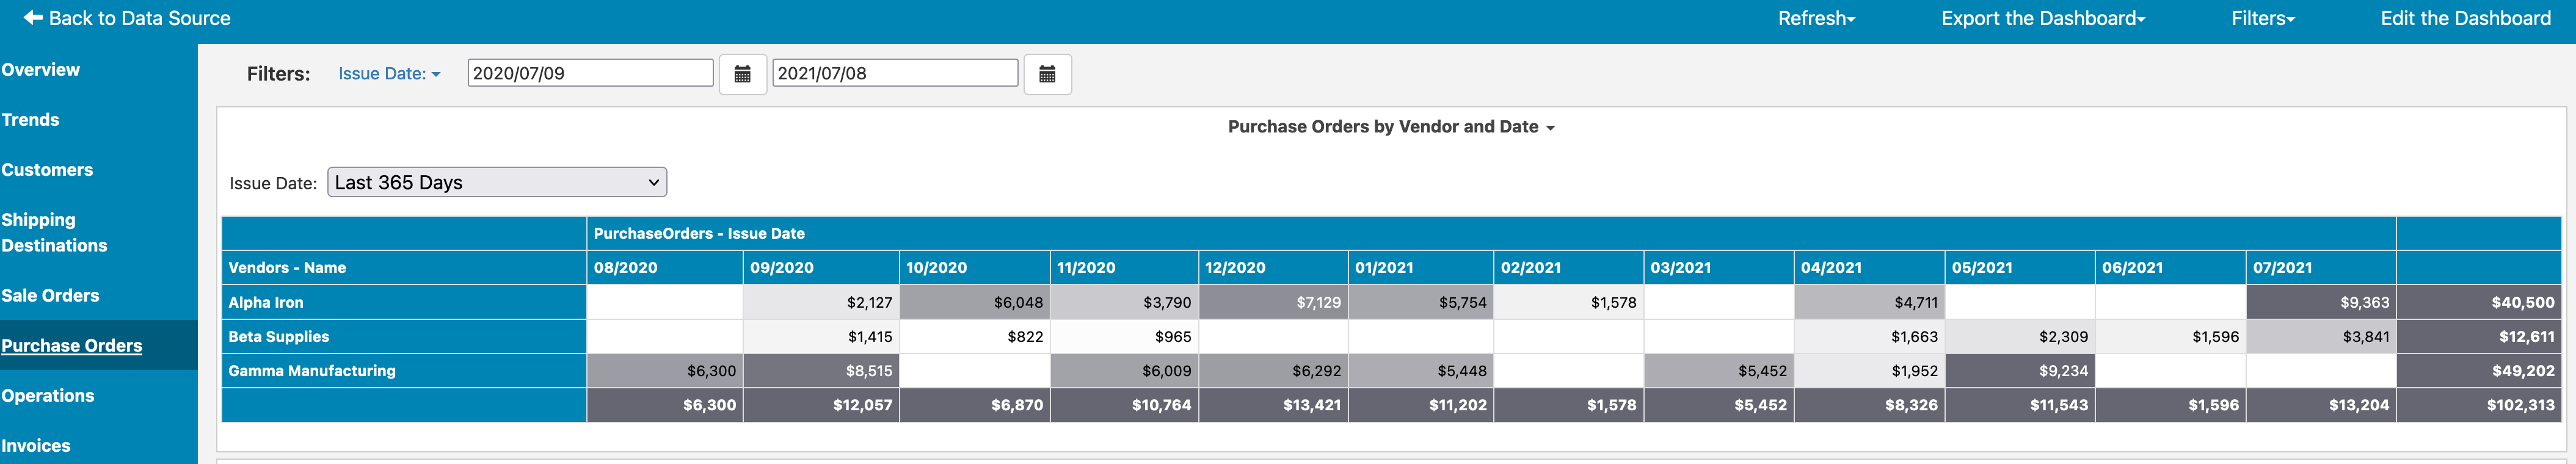
The Purchase Orders tab show you purchases by supplier over time, as well as detailed searchable information around your purchase orders.
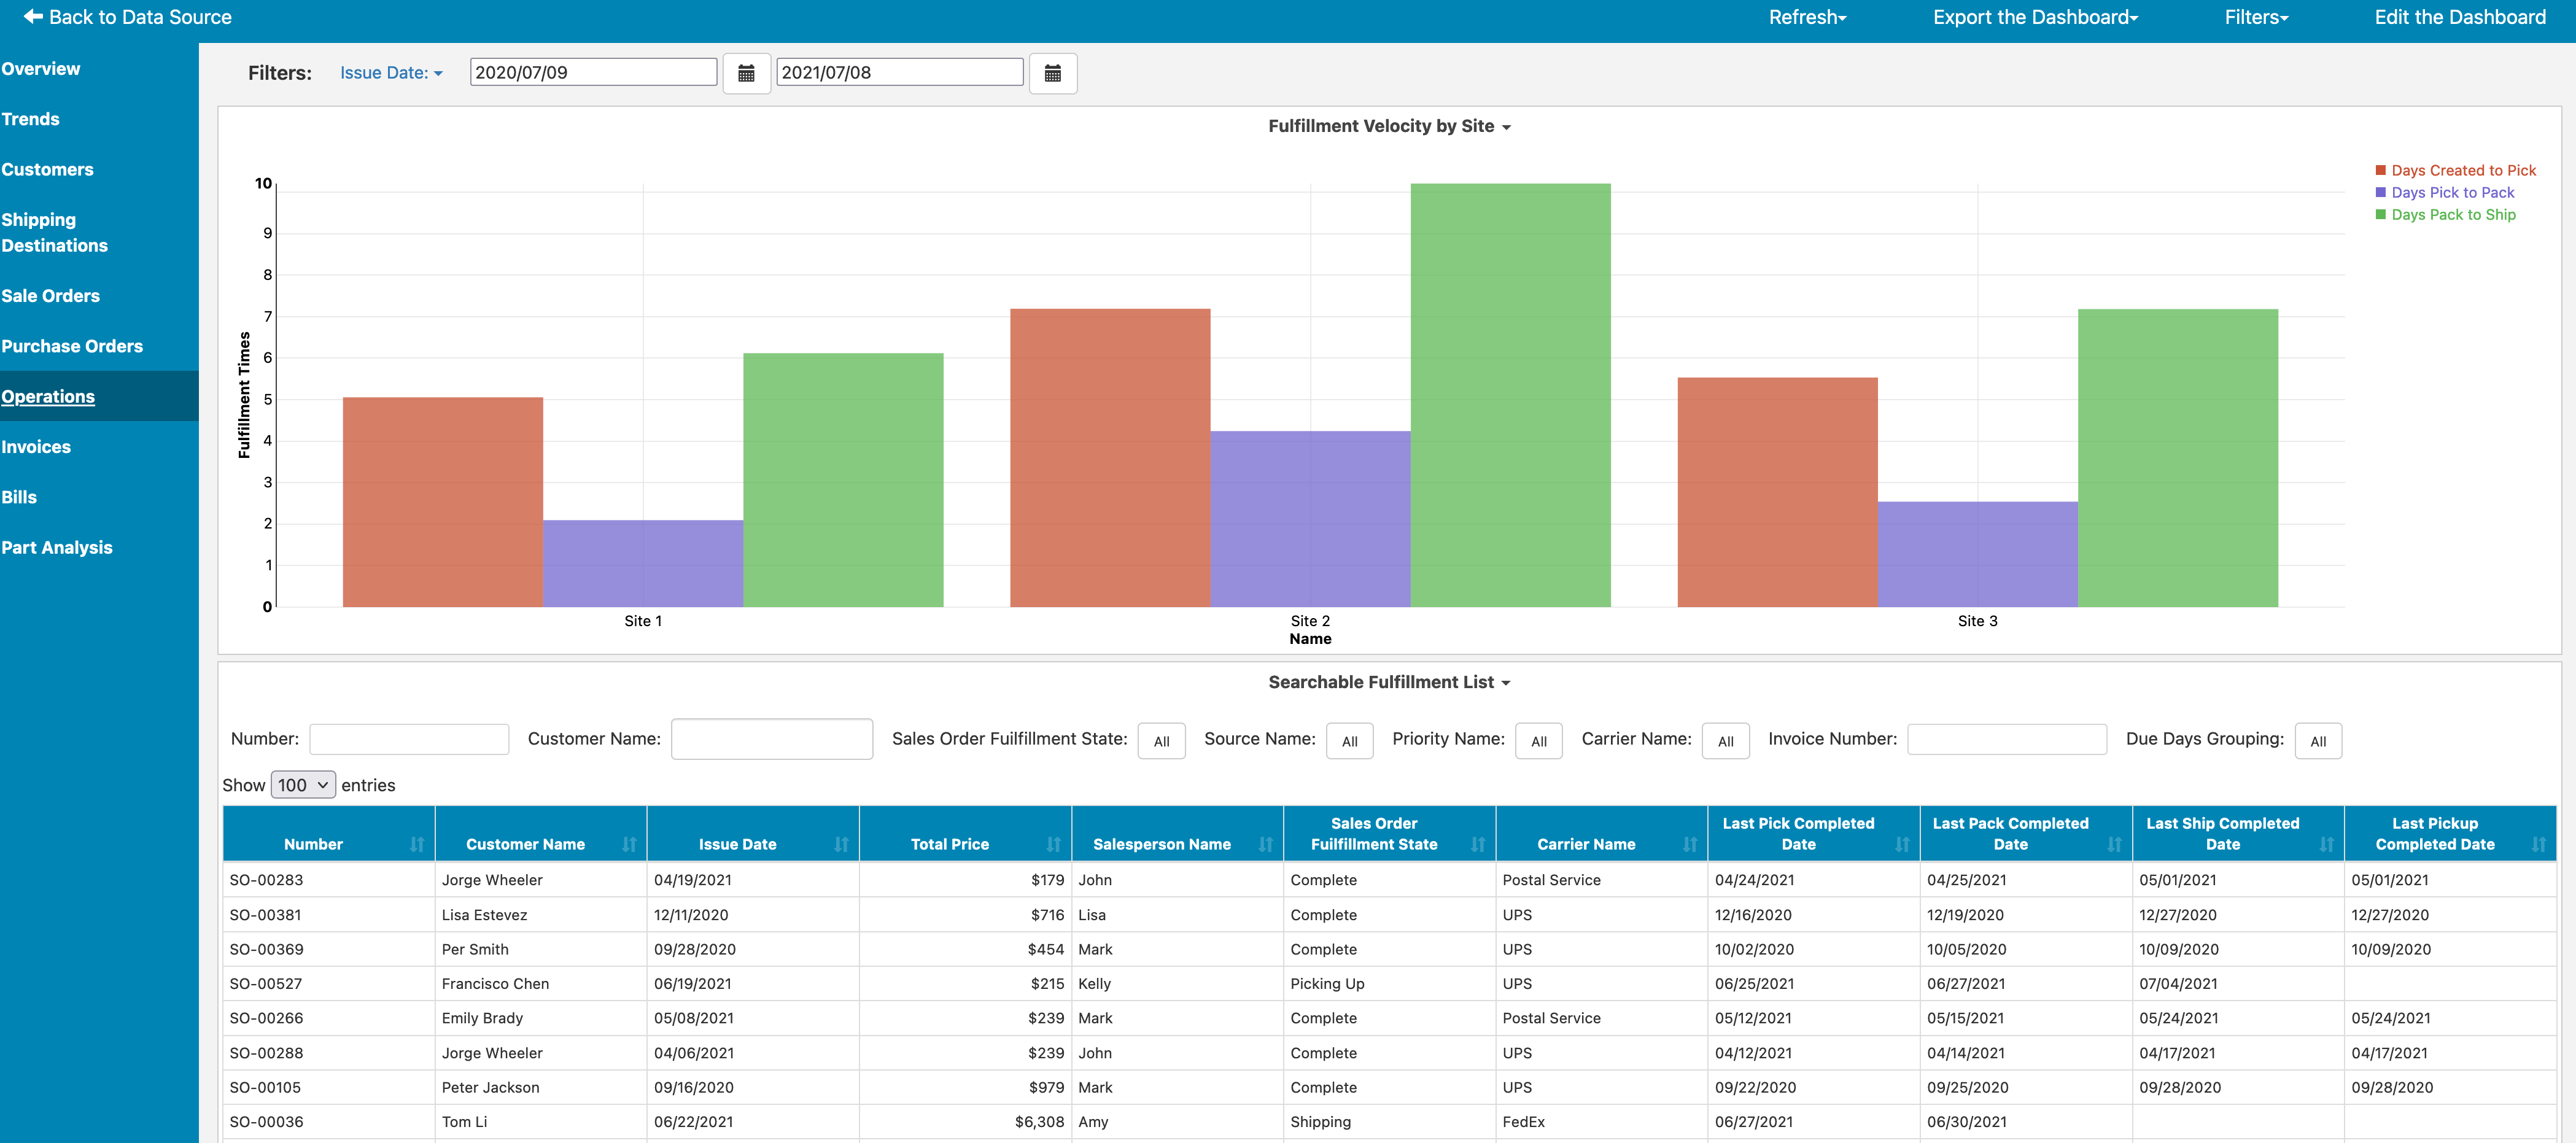
The Operations tab helps you to look at pick, pick, and ship performance by site.
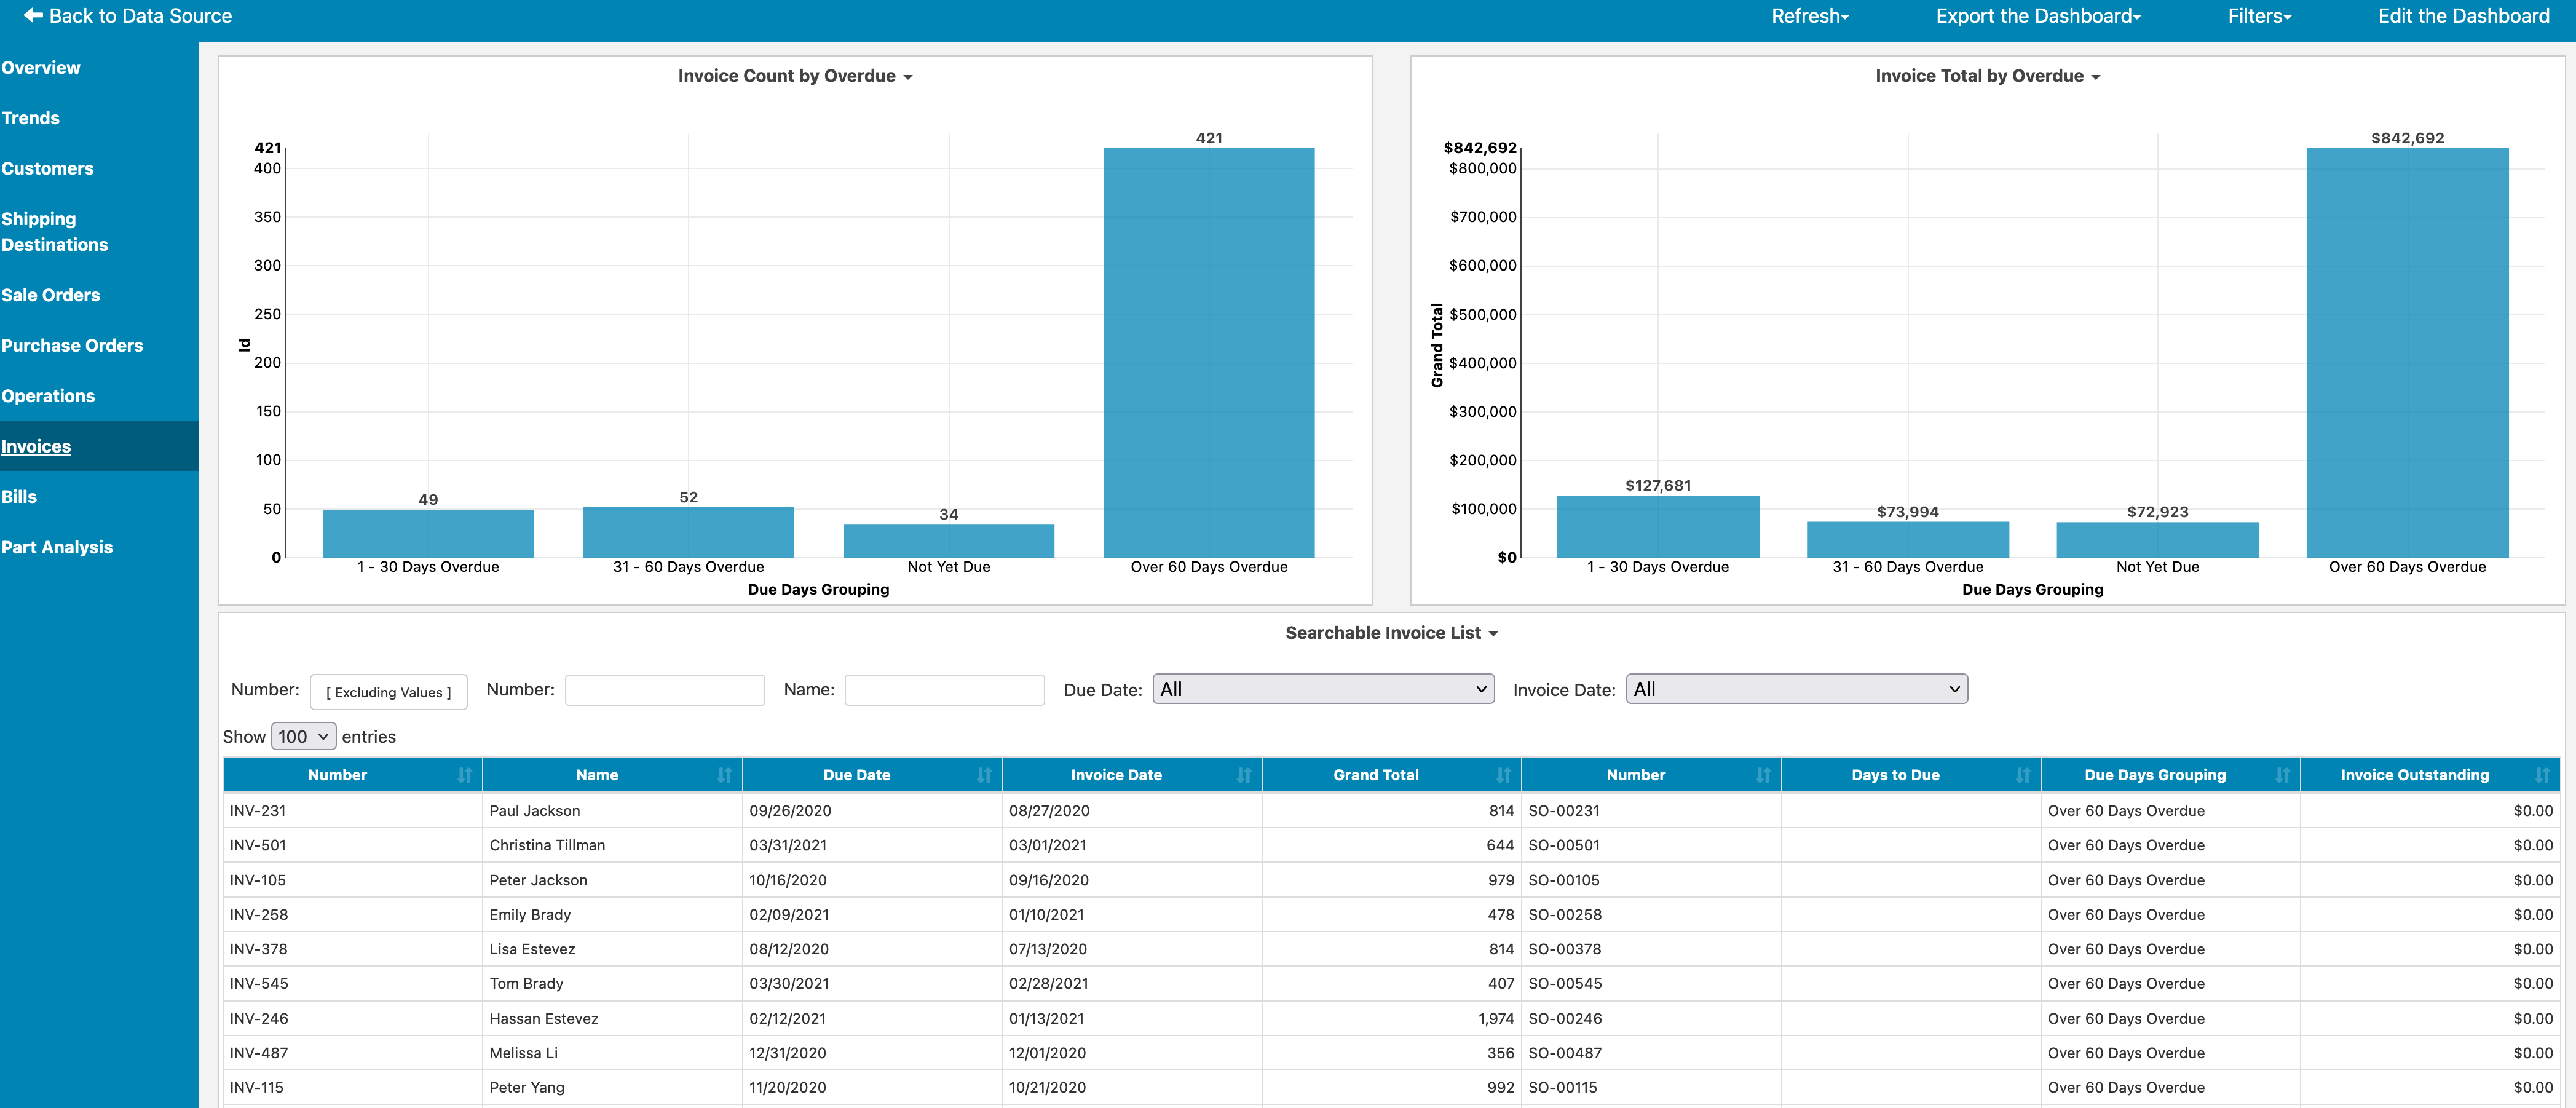
The Invoices tab gives you reports on aging receivables, including the quantity and amounts of sales orders awaiting payment.
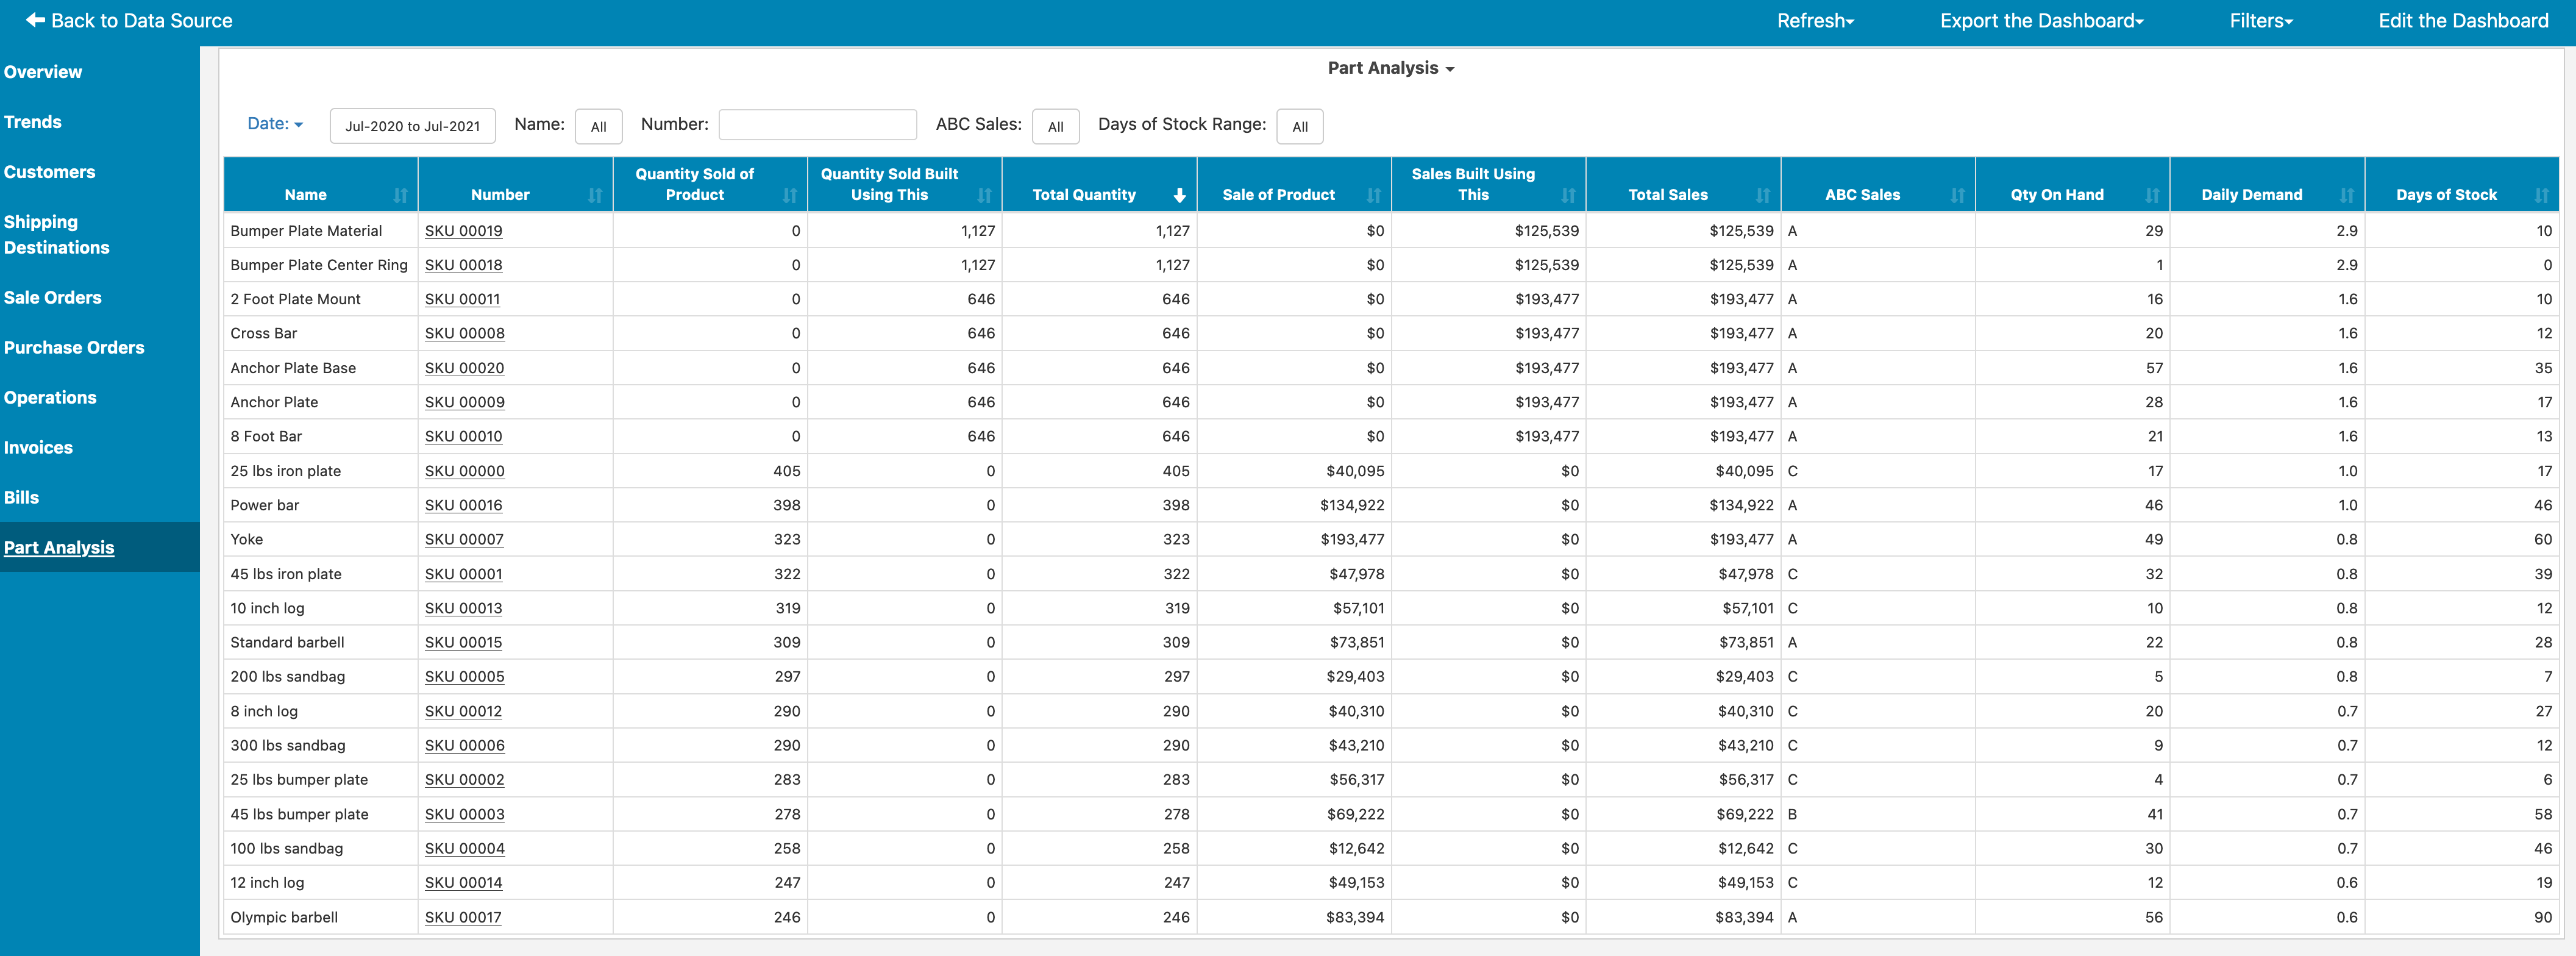
The Part Analysis tab shows you quantities and sale amount of each SKU sold in the specified time period. It also shows you the quantity and sale amount for all products that use that SKU in their bill of materials, helping you to identify critical SKUs in the production process. You can see quantity on hand, daily demand, and days of stock. You can also see an ABC analysis of the sale amount, where A contains the SKUs contributing 80% of your business, B contains SKUs contributing the next 15%, and C contains the remaining SKUs. You can click on a SKU to dive into more detail about the product:
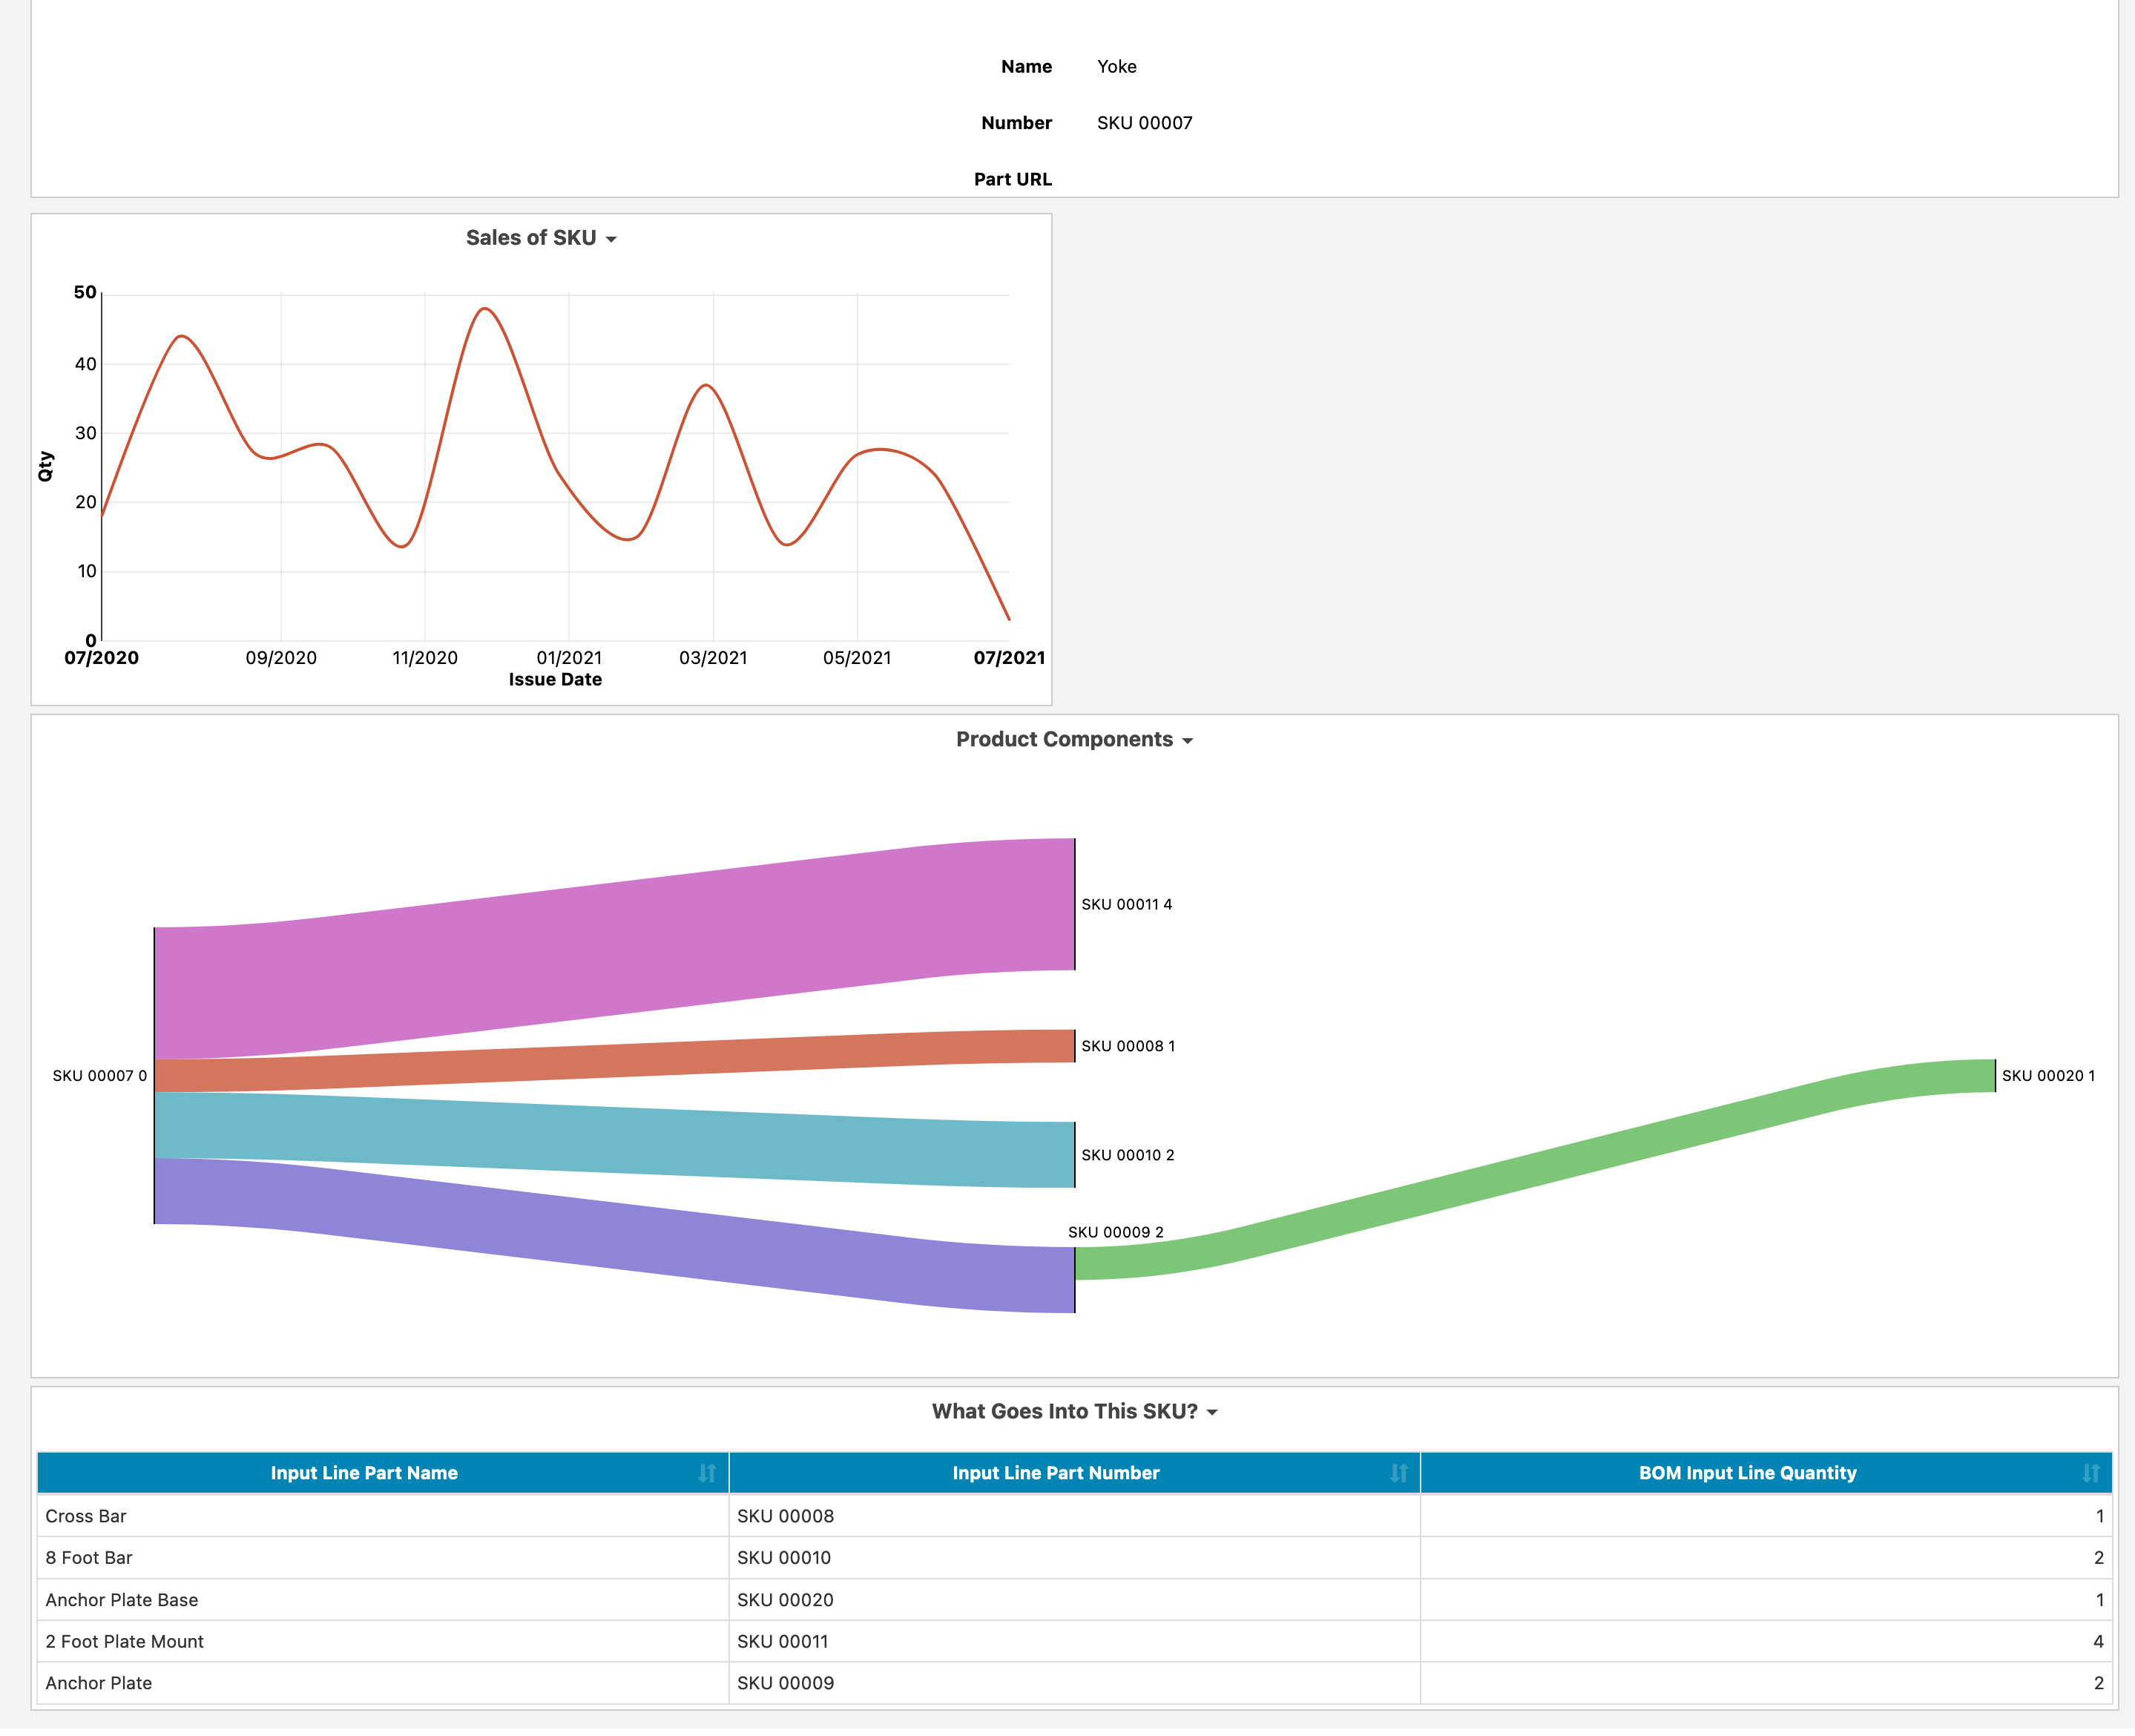
By clicking on a SKU from Part Analysis, a drillthrough dashboard shows you sales of the SKU over time, purchase order price of the SKU over time (if applicable) per supplier, a visualization of the products used to assemble the chosen SKU, and tables of what's used to build and what's built off of the selected SKU.
When you click on Choose Field in the report editor, you'll see the various fields available to you from your LOCATE Inventory data. These fields include everything from Sales, Invoices, Customers, Purchase Orders, Reconciles, Receipts, Picks, Packs, Ships, Pickups, Transfer Orders, Manufacturing Orders, Bills of Material, and more.
You can add these different fields to build a report. For example, changing the report type to Column, then adding Salesperson Name as the X Axis and Total Price as the measure, gives you a simple column chart.
For more information on building reports, please see Creating Reports.
Want to receive a list of open, overdue invoices across your team every Monday? You can set up reports and dashboards as emails on a schedule. For more information on scheduling, see Scheduling Reports as Emails.
You can also combine your LOCATE Inventory data with other connections, building reports and dashboards that combine your ERP data with your support, CRM, or financial services. To learn how to combine data sources, see Combining Data Sources.
Make sure your users or clients can only see the information you want them to see, without creating numerous copies of reports. Learn how to set up data level security at https://www.easy-insight.com/docs/account/data-level-security.html.
Your connection is refreshed on a nightly basis. You can control when the refresh happens through the Scheduling page. You can also set up near real time reports at a 5 minute interval.
You'll need to have an account of at least the Professional level ($149 / mo).