Easy Insight Logo
Call 1-(720)-316-8174

Easy Insight and Teamwork Documentation

Installation

Once you have an Easy Insight account, you can create a connection to Teamwork through the Connections page. Click on Teamwork, then click on Authorize Access. You'll be redirected to Teamwork to grant access to Easy Insight, then redirected back to Easy Insight. Easy Insight will initially pull over the last two full months of data, then load the remaining data in the background.

When you first install your connection to Teamwork in Easy Insight, you'll get a prebuilt dashboard with a variety of reports to help you get started. You can customize any of these reports or replace them with your own.


Prebuilt Dashboard

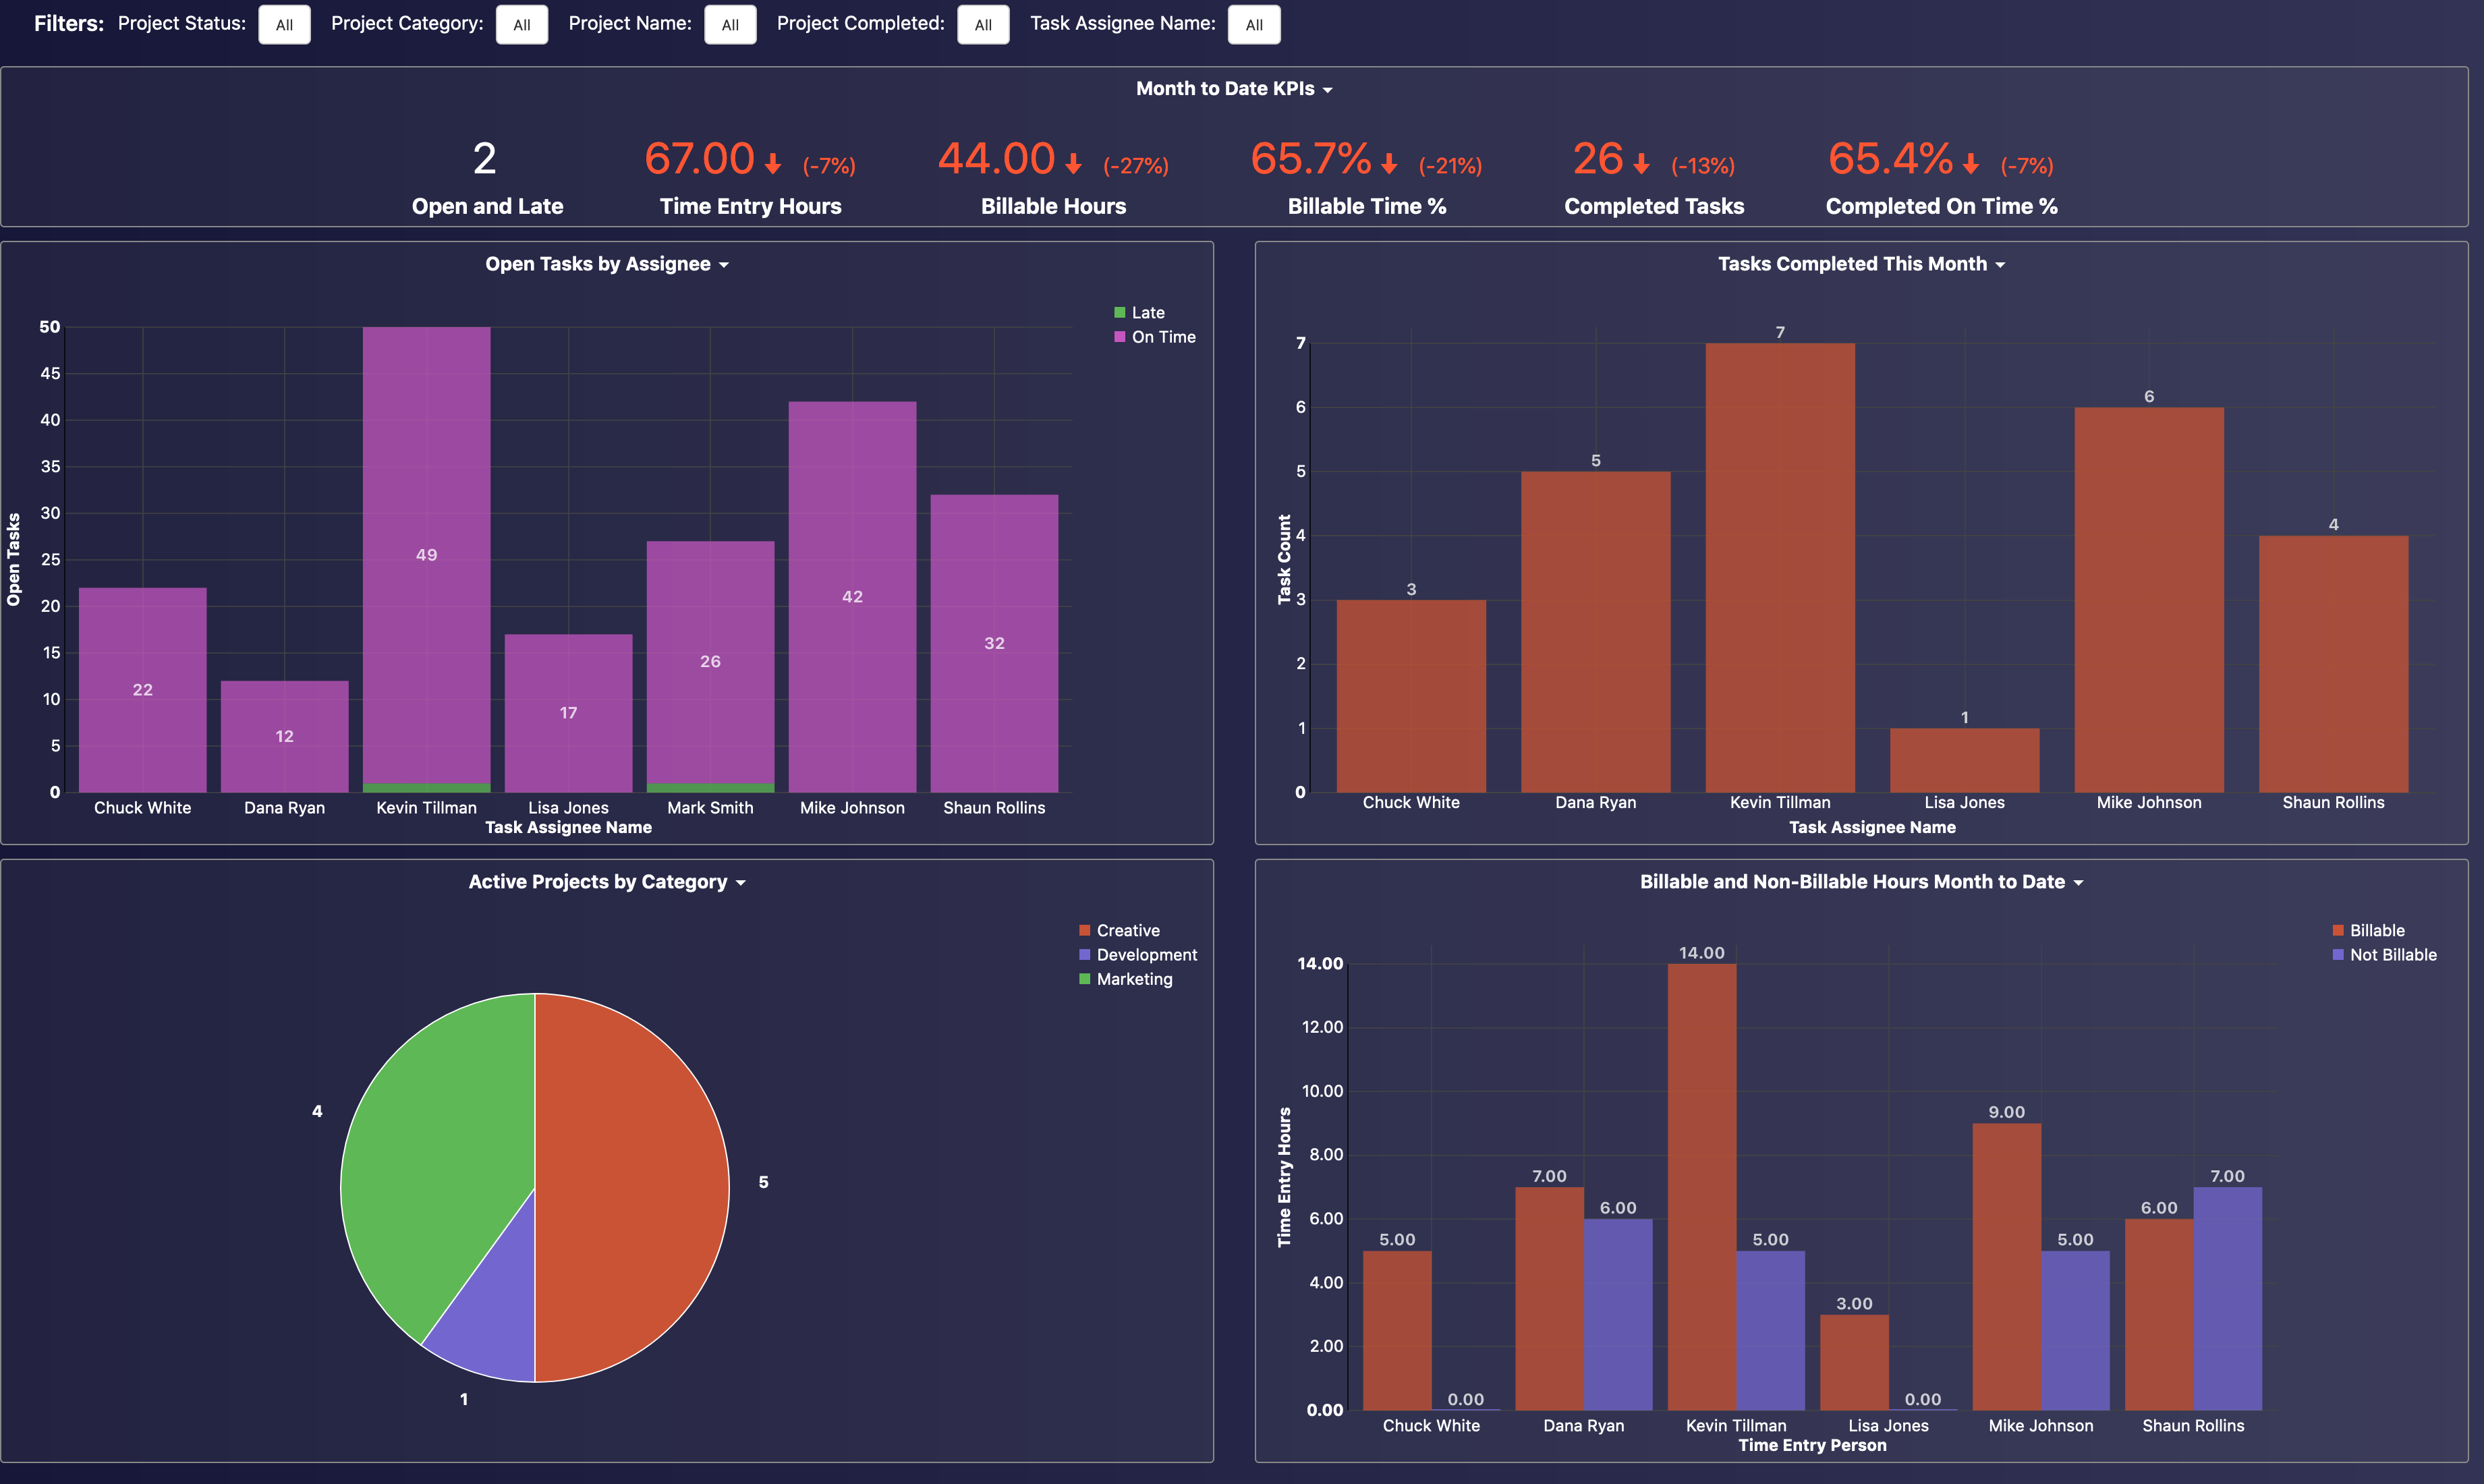
Teamwork Dashboard Overview

The overview provides you with a look at your current performance this month, with charts to show open tasks by assignee, completed tasks by assignee, active projects by category, and billable/non-billable hours worked.

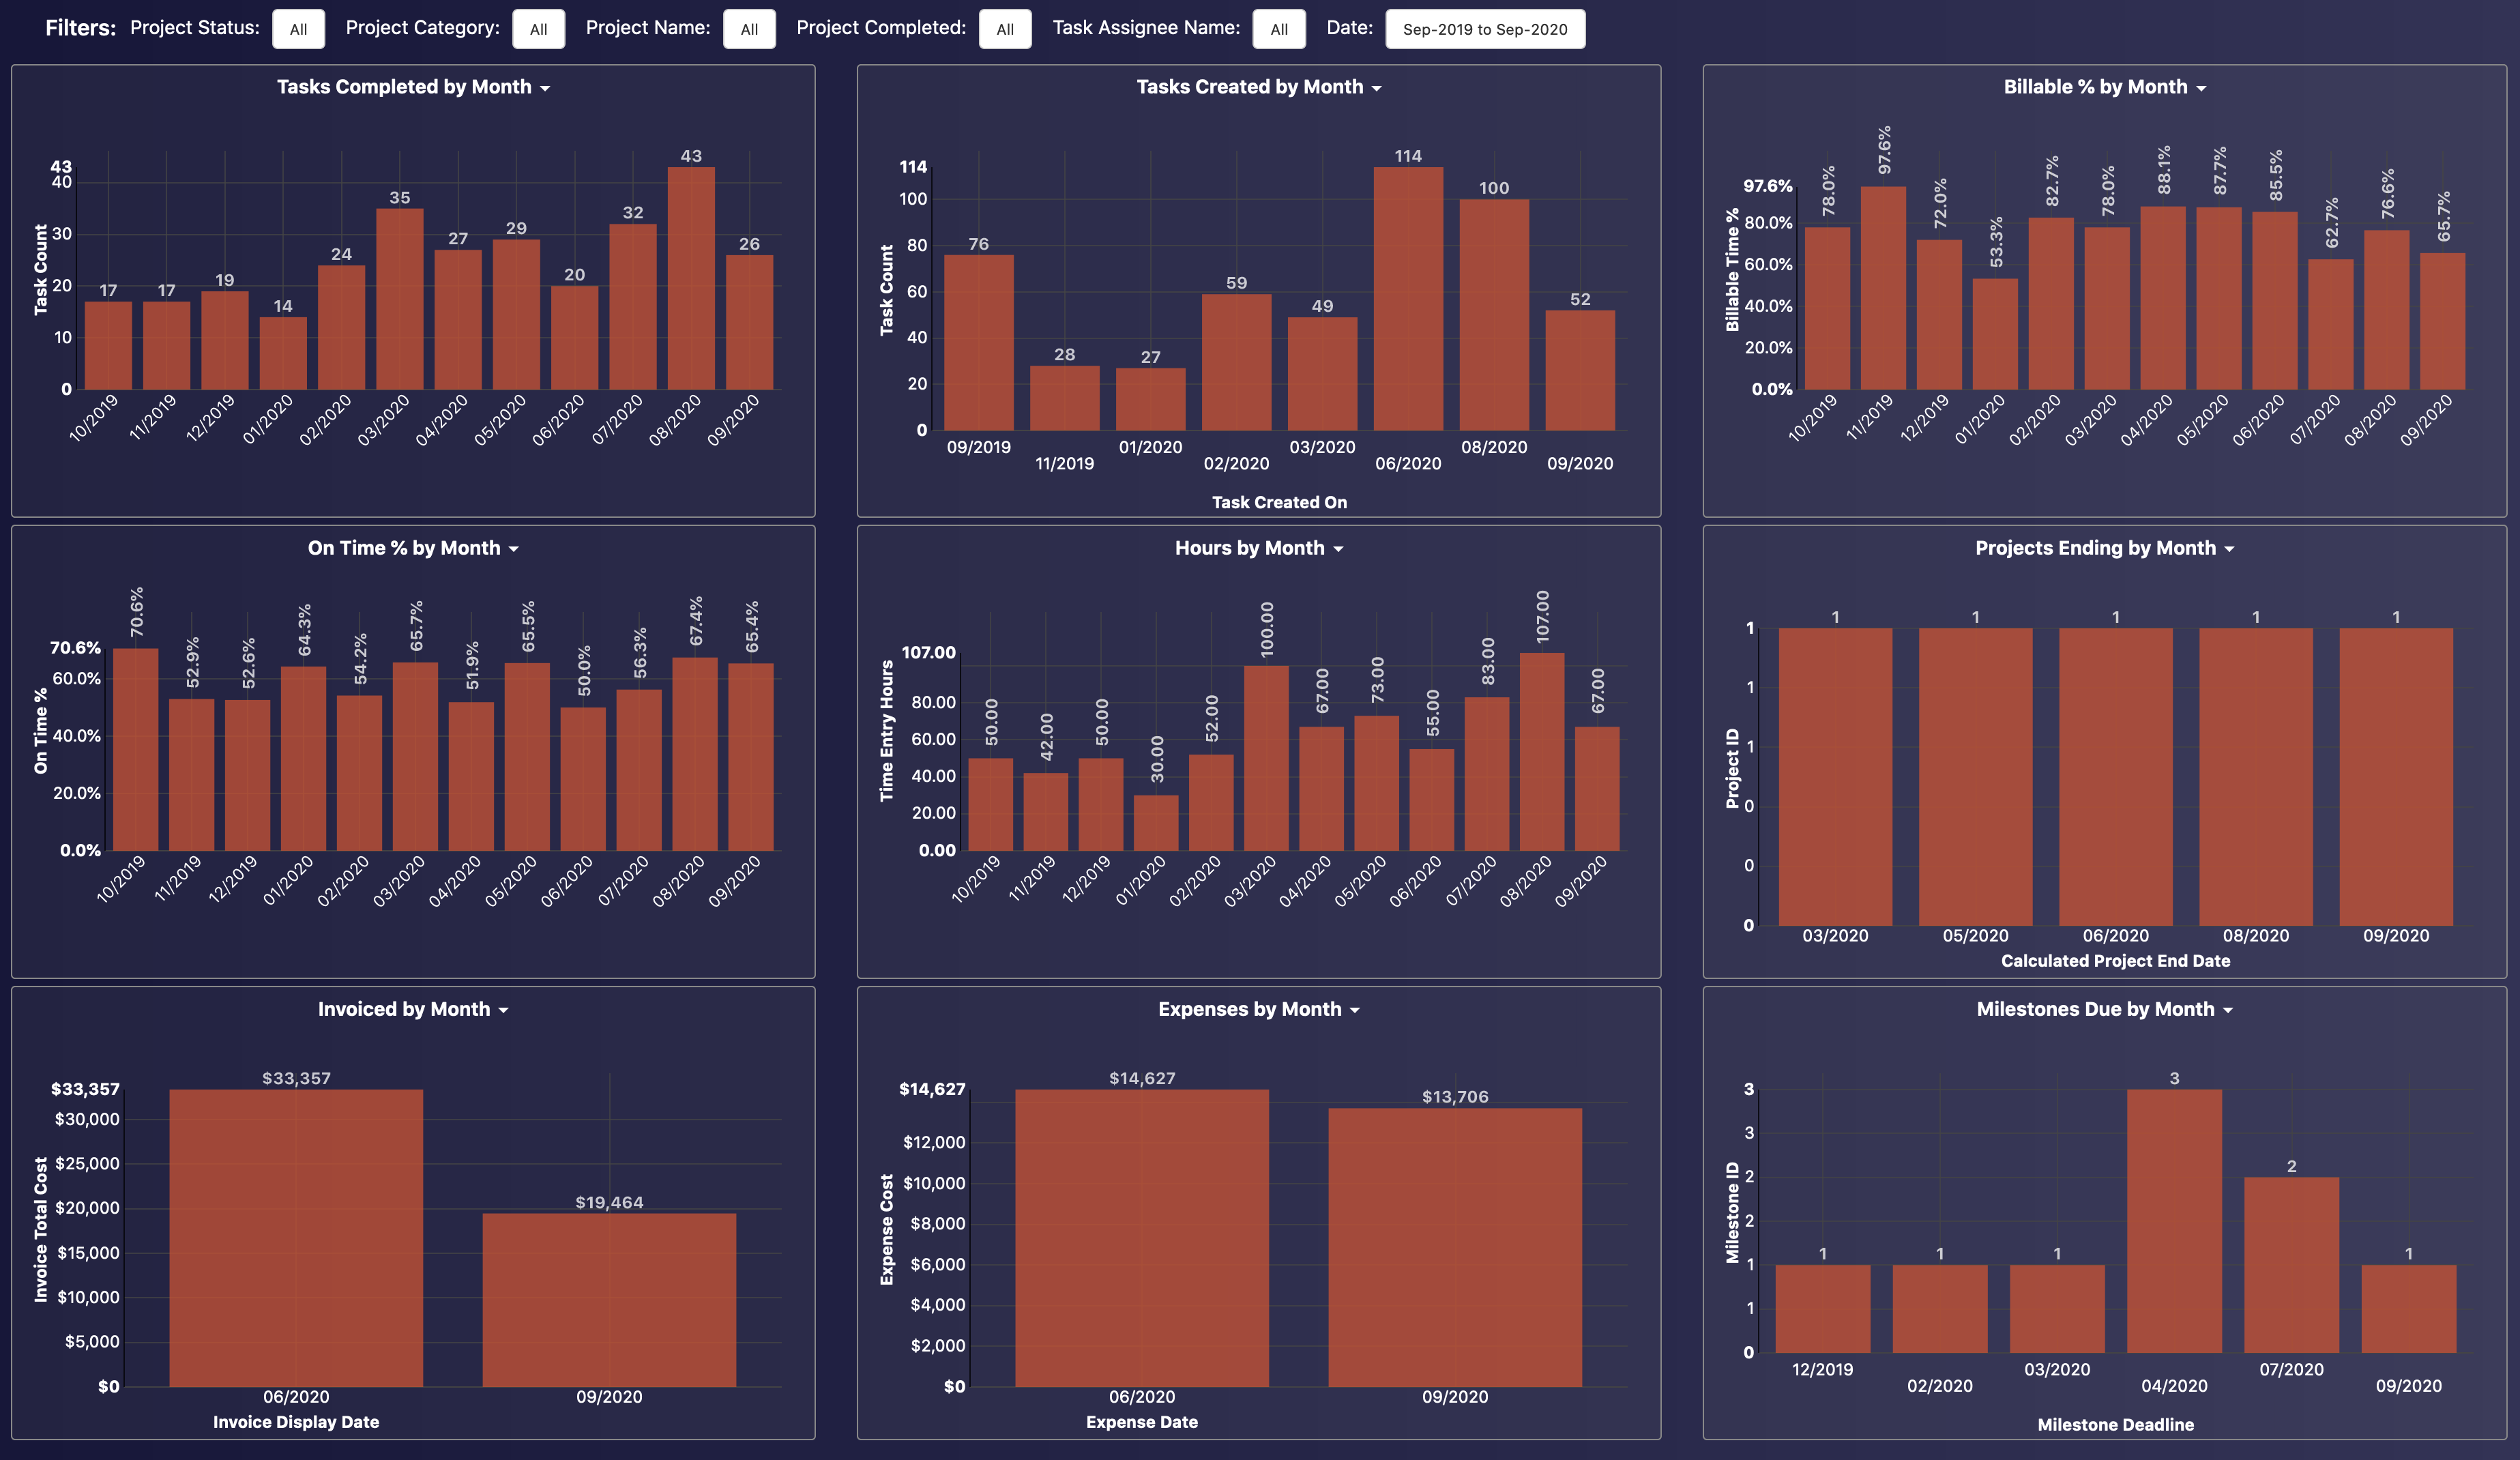
Trends help you understand historical performance of your project management team, showing a variety of metrics month over month. You can change the date filter to look at different date ranges.

Teamwork Trends
Teamwork Upcoming Work Allocation

Resource Allocation helps you to see upcoming work by assignee week over week and identify resources that may be overloaded relative to their usual workload.

The Gantt chart helps you to visualize projects and their task load over the upcoming months.

Teamwork Gantt Chart
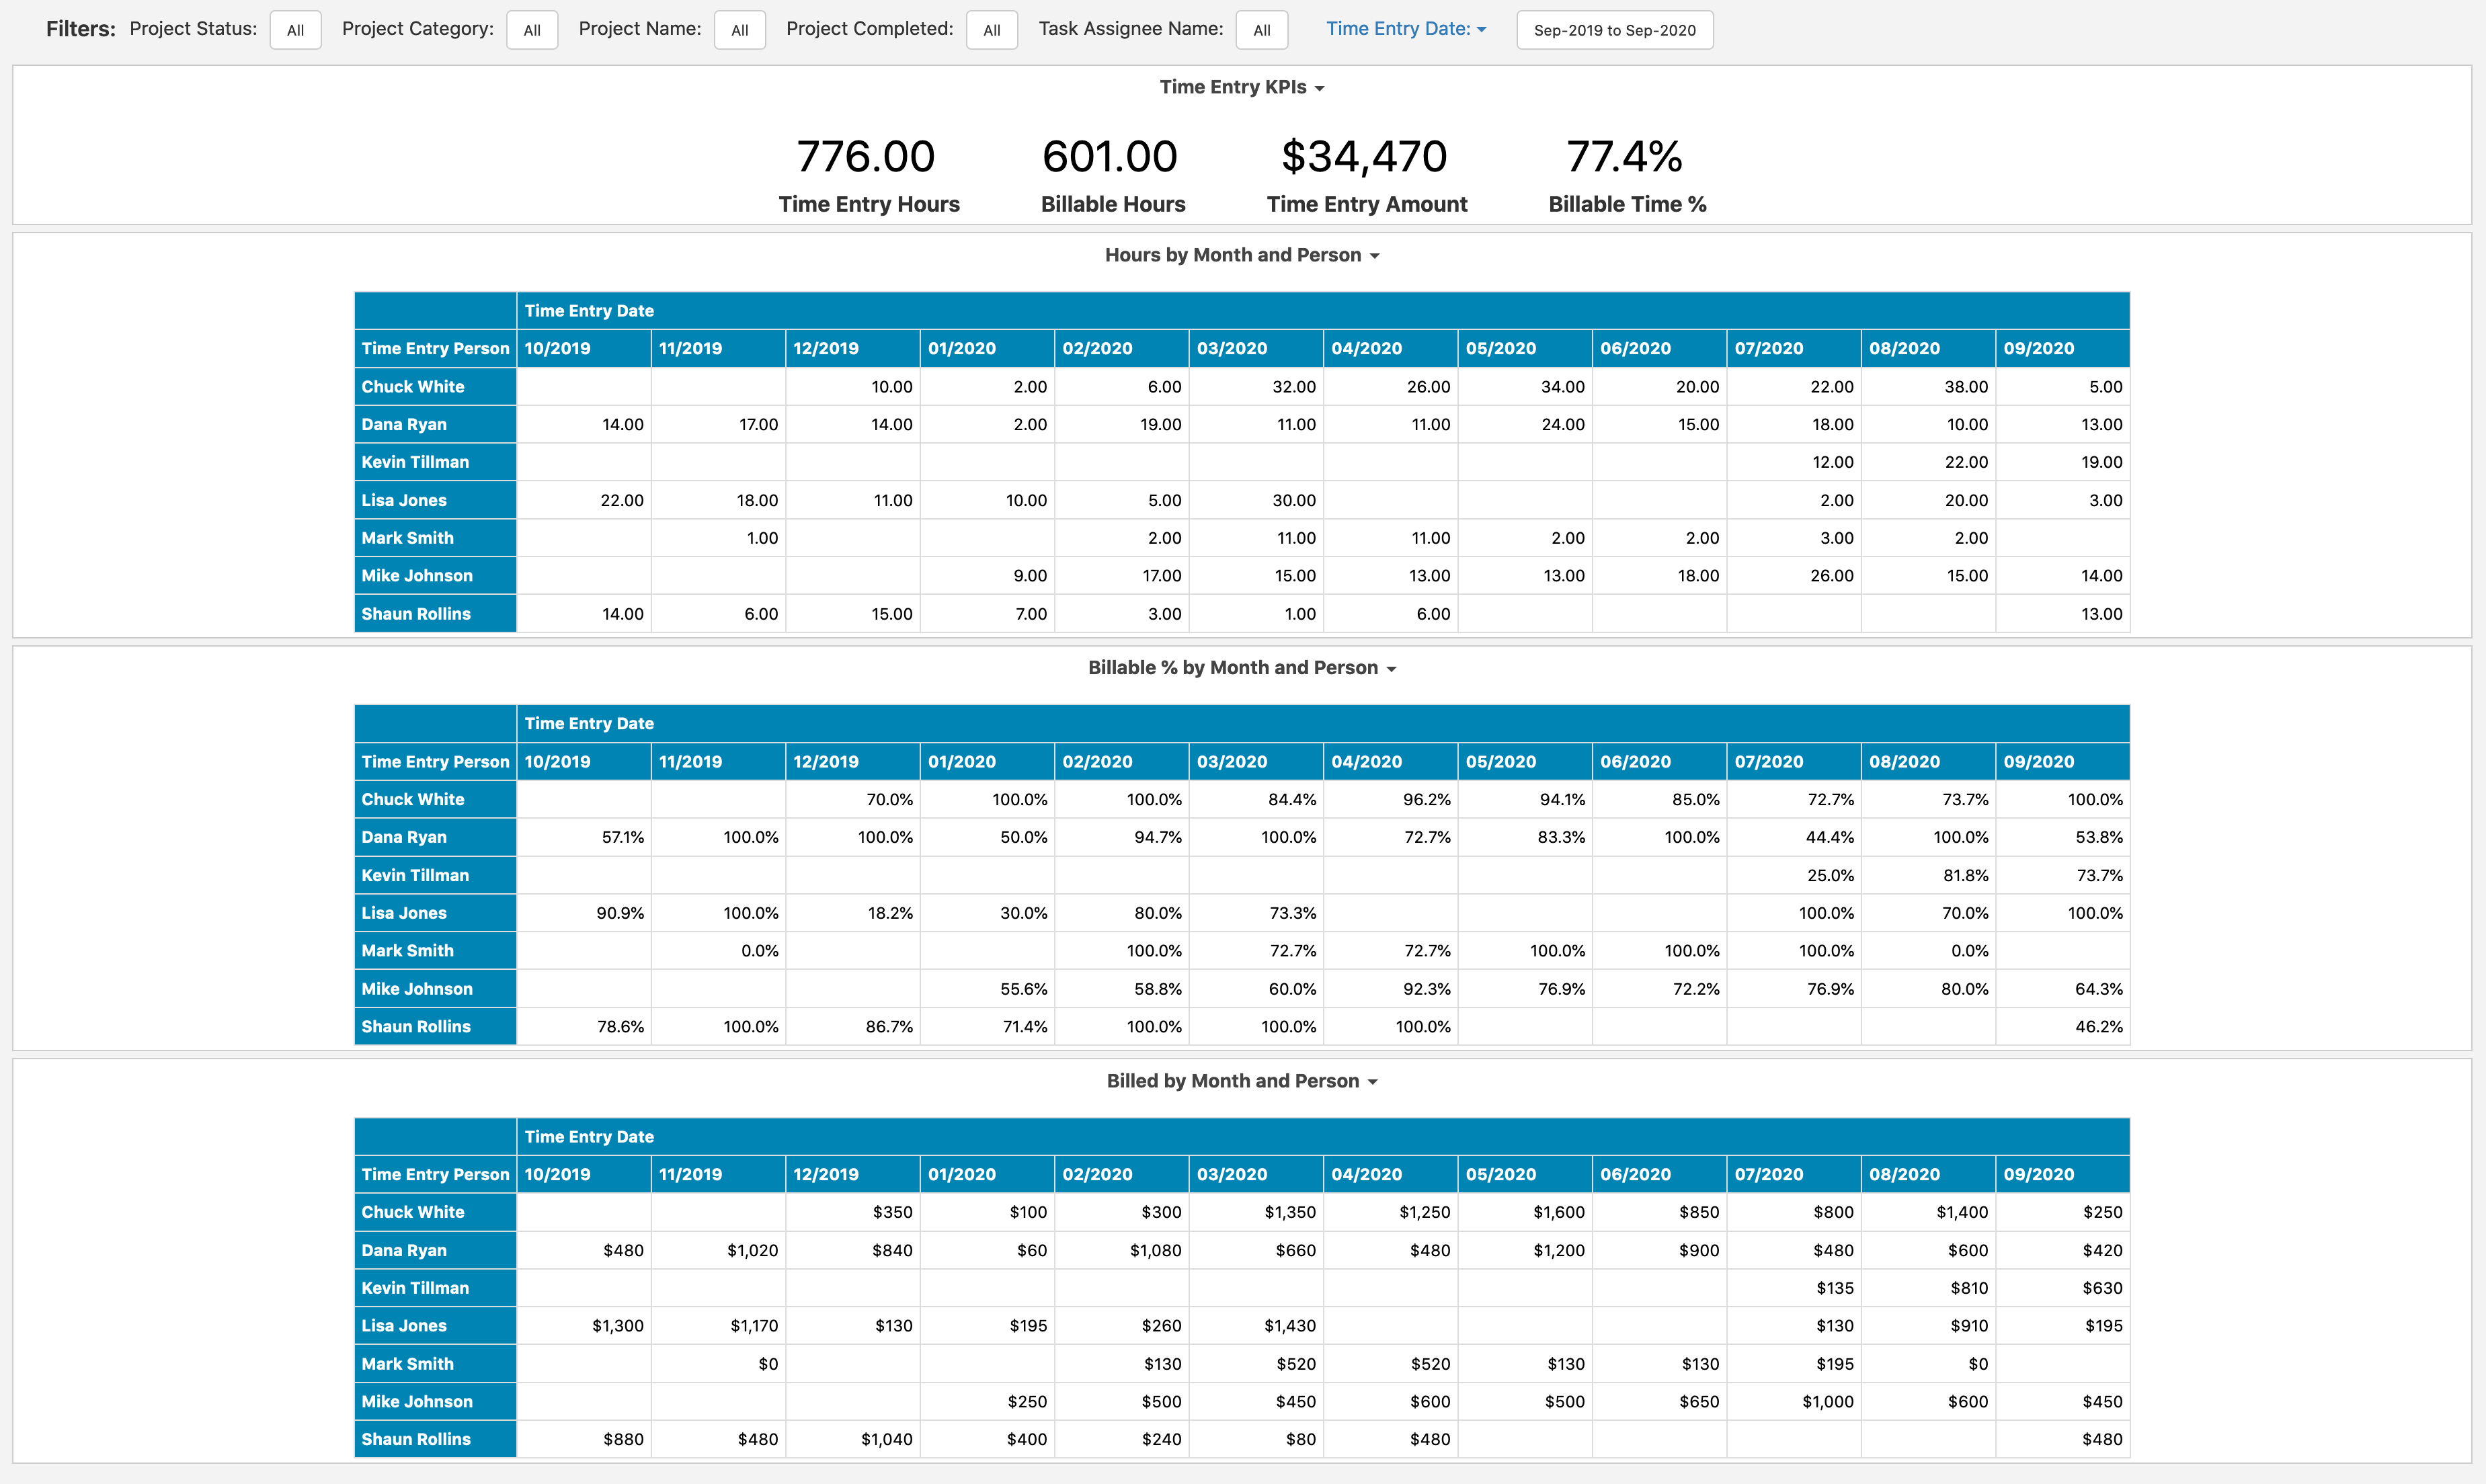
Teamwork Time Reports

Various tables help you to visualize time, billable %, and amount billed by month and person.

Look at risks across projects, with highlighting for probability and impact.

Teamwork Risk Reports

Custom Reports

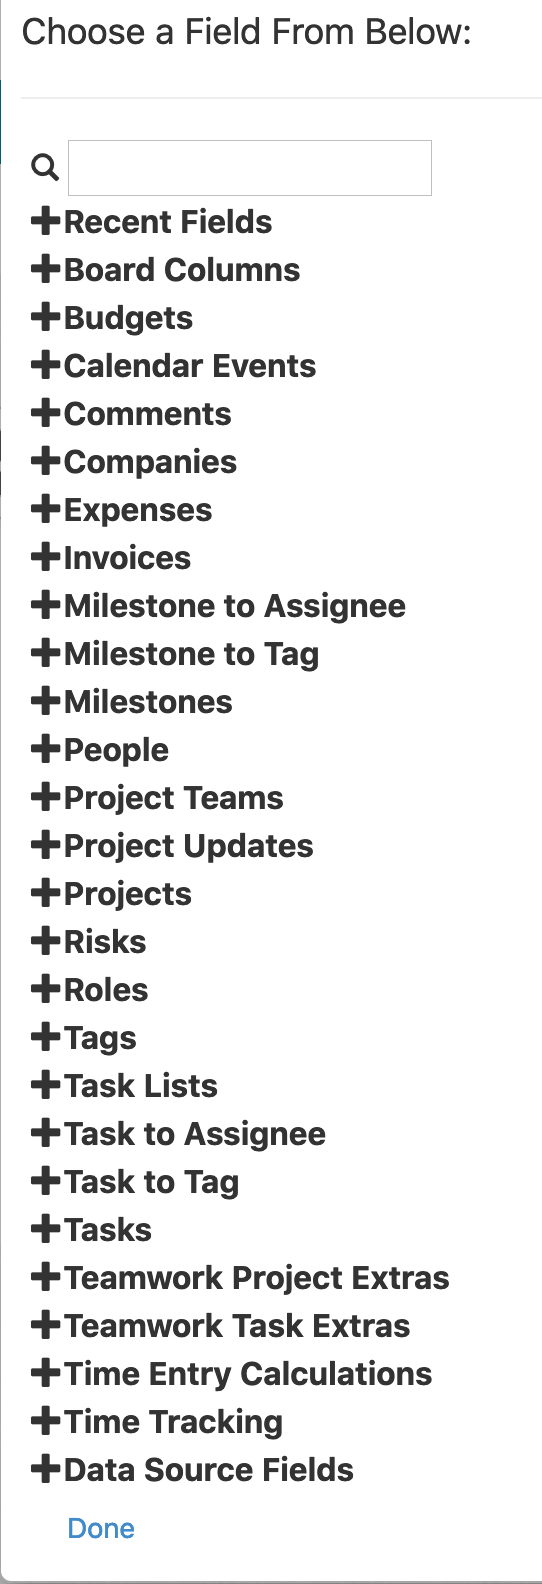
When you click on Choose Field in the report editor, you'll see the various fields available to you from your Teamwork data. These fields do include custom project and task fields as well, as the various subjects shown below:

Field Selection

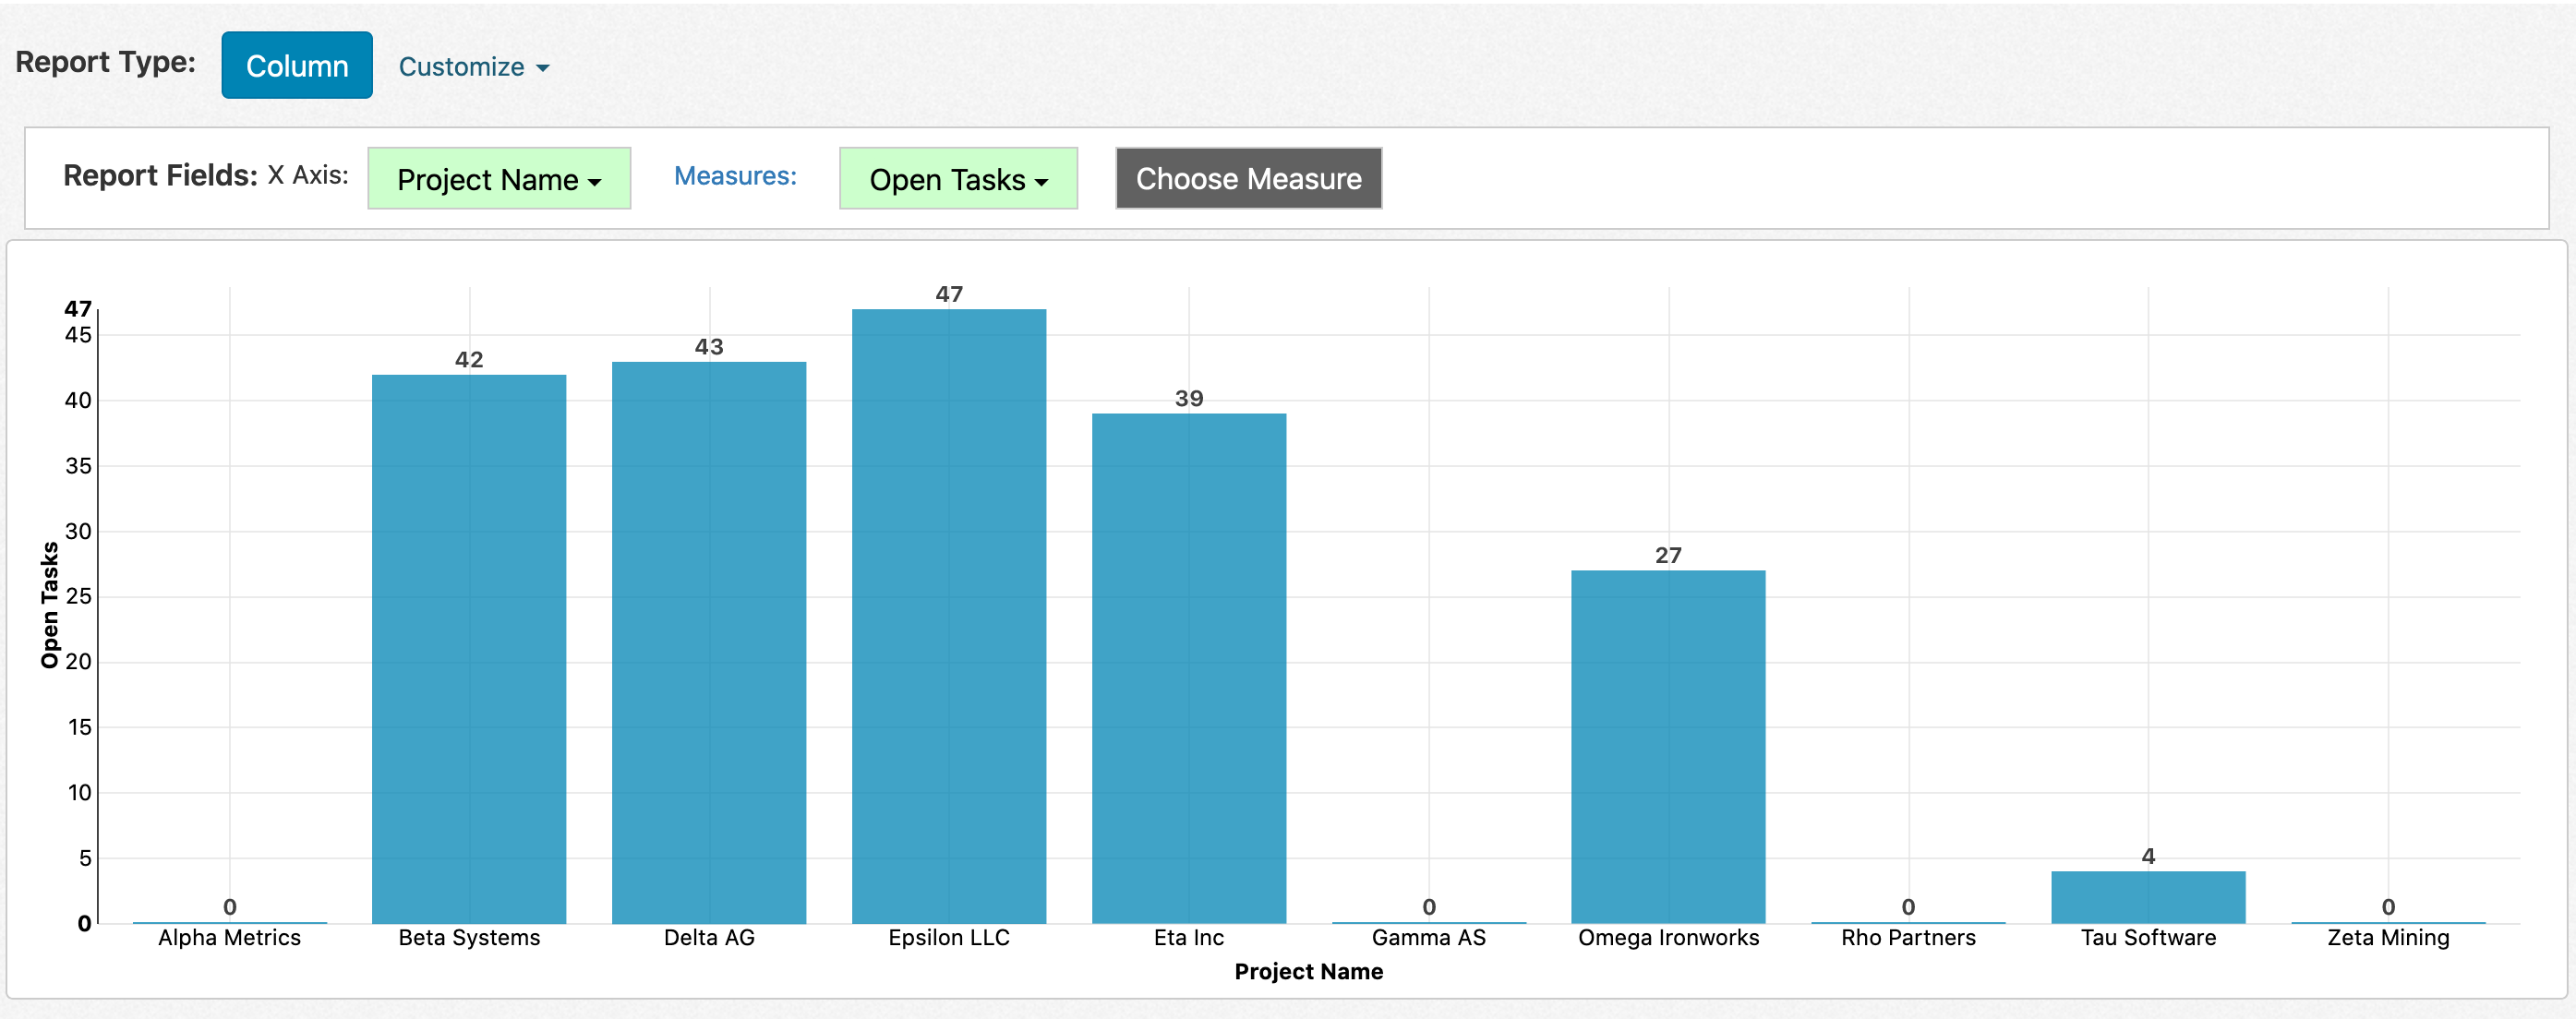
You can add these different fields to build a report. For example, changing the report type to Column, then adding Project Name as the X Axis and Open Tasks as the measure, gives the following column chart:

Sample Column Chart

For more information on building reports, please see Creating Reports.

More Features

Want to receive a list of open, overdue tasks across your team every Monday? You can set up reports and dashboards as emails on a schedule. For more information on scheduling, see Scheduling Reports as Emails.

You can also combine your Teamwork data with other connections, building reports and dashboards that combine your project management data with your support, CRM, or financial services. To learn how to combine data sources, see Combining Data Sources.

Make sure your users or clients can only see the information you want them to see, without creating numerous copies of reports. Learn how to set up data level security at https://www.easy-insight.com/docs/account/data-level-security.html.

FAQ

How often does the connection pull over data?

Your connection is refreshed on a nightly basis. You can control when the refresh happens through the Scheduling page. If your account is on the Professional tier or higher, you can set up near real time reports at a 5 minute interval.


Sample of Teamwork Fields

The number of currently active projects.

The number of hours worked where Time Entry Billable was set to True

The name of the company as associated to different projects.

Zip code assigned to the company. You can use this field in displaying maps of where your customers are.

Count of the number of tasks completed late.

Count of the number of tasks completed on time.

Count of the number of completed tasks.

The number of hours worked where Time Entry Billable was set to False.

Whether or not all tasks in the project have been completed.

Who was the assignee of the first overdue task in the project? This field can help with root cause analysis for projects falling behind.

What was the first overdue task in the project? This field can help with root cause analysis for projects falling behind.

Whether or not the task has been completed.

The date at which the task was completed.

The number of tasks.

The date at which the task was created.

The person who created the task.

The description associated to the task.

The date at which the task is due to be completed.

The estimated cost of the task, based on the assigned's user hourly rate and the estimated amount of time.

The estimated amount of time in the task in hours.

The estimated amount of time in the task in minutes.

The internal ID of the task.

The amount billed for the time entry, based on the user's rate in Teamwork and the number of hours in the time entry.

Whether or not a time entry was billable.

The quantity of time entries.

The date for which the time entry was logged.

The description associated with the time entry.

The number of time entry hours.

The internal ID of the time entry in Teamwork.

The invoice number associated to the time entry.

The person who worked on the time entry.