When you first install your connection to Teamwork Desk in Easy Insight, you'll get a prebuilt dashboard with a variety of reports to help you get started. You can customize any of these reports or replace them with your own.
The dashboard includes the following pages:
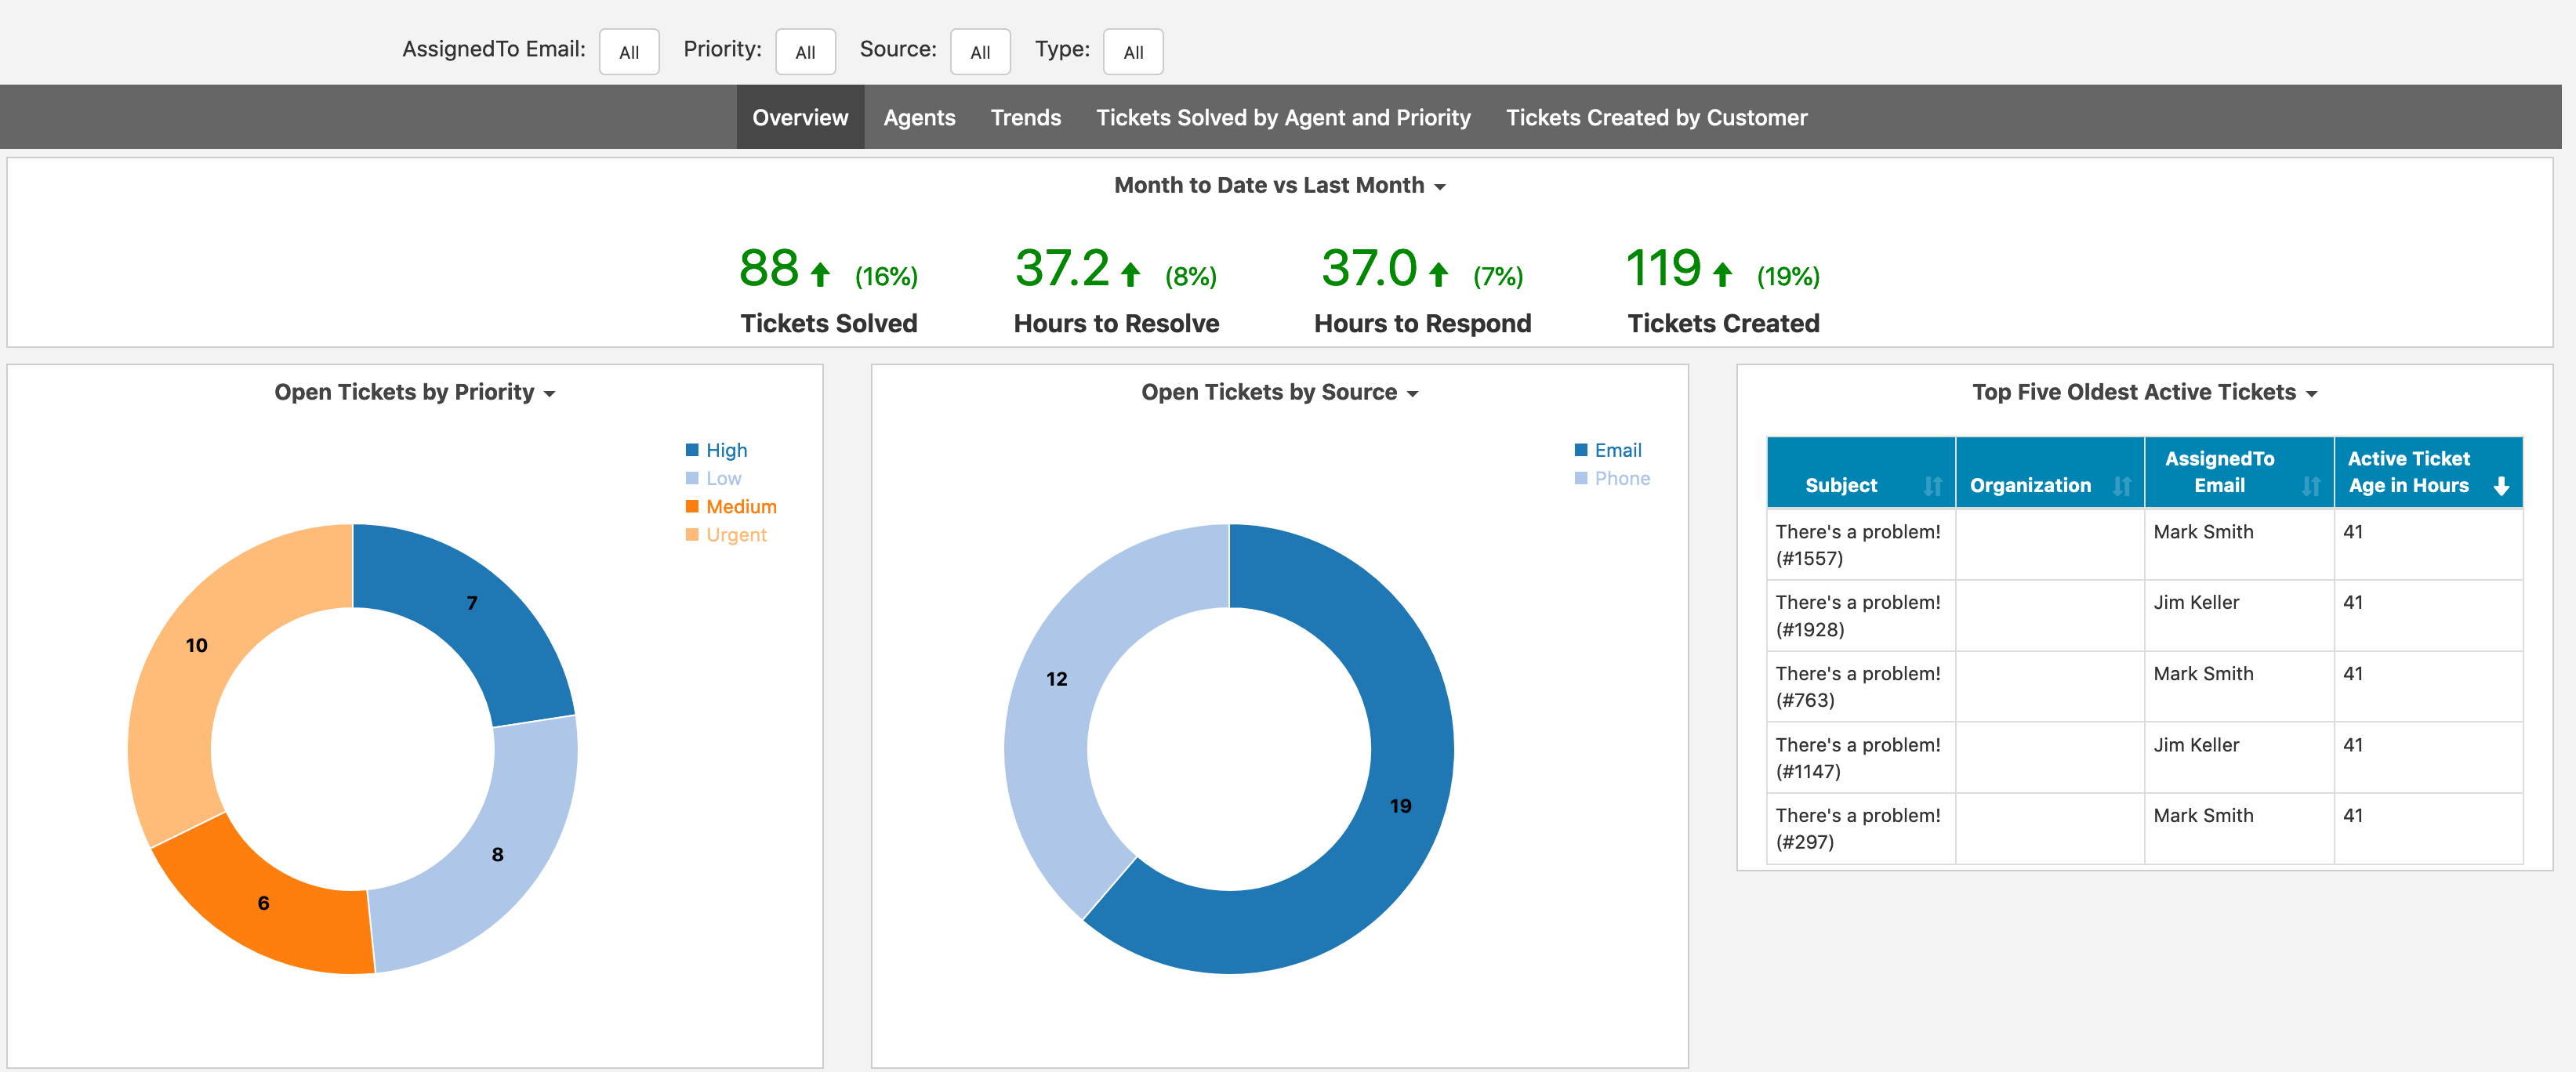
The overview provides a view into your support key performance indicators, visualization of open tickets by priority and source, the five oldest active tickets, tickets created and solved for the four last weeks, and ticket happiness ratings month to date.
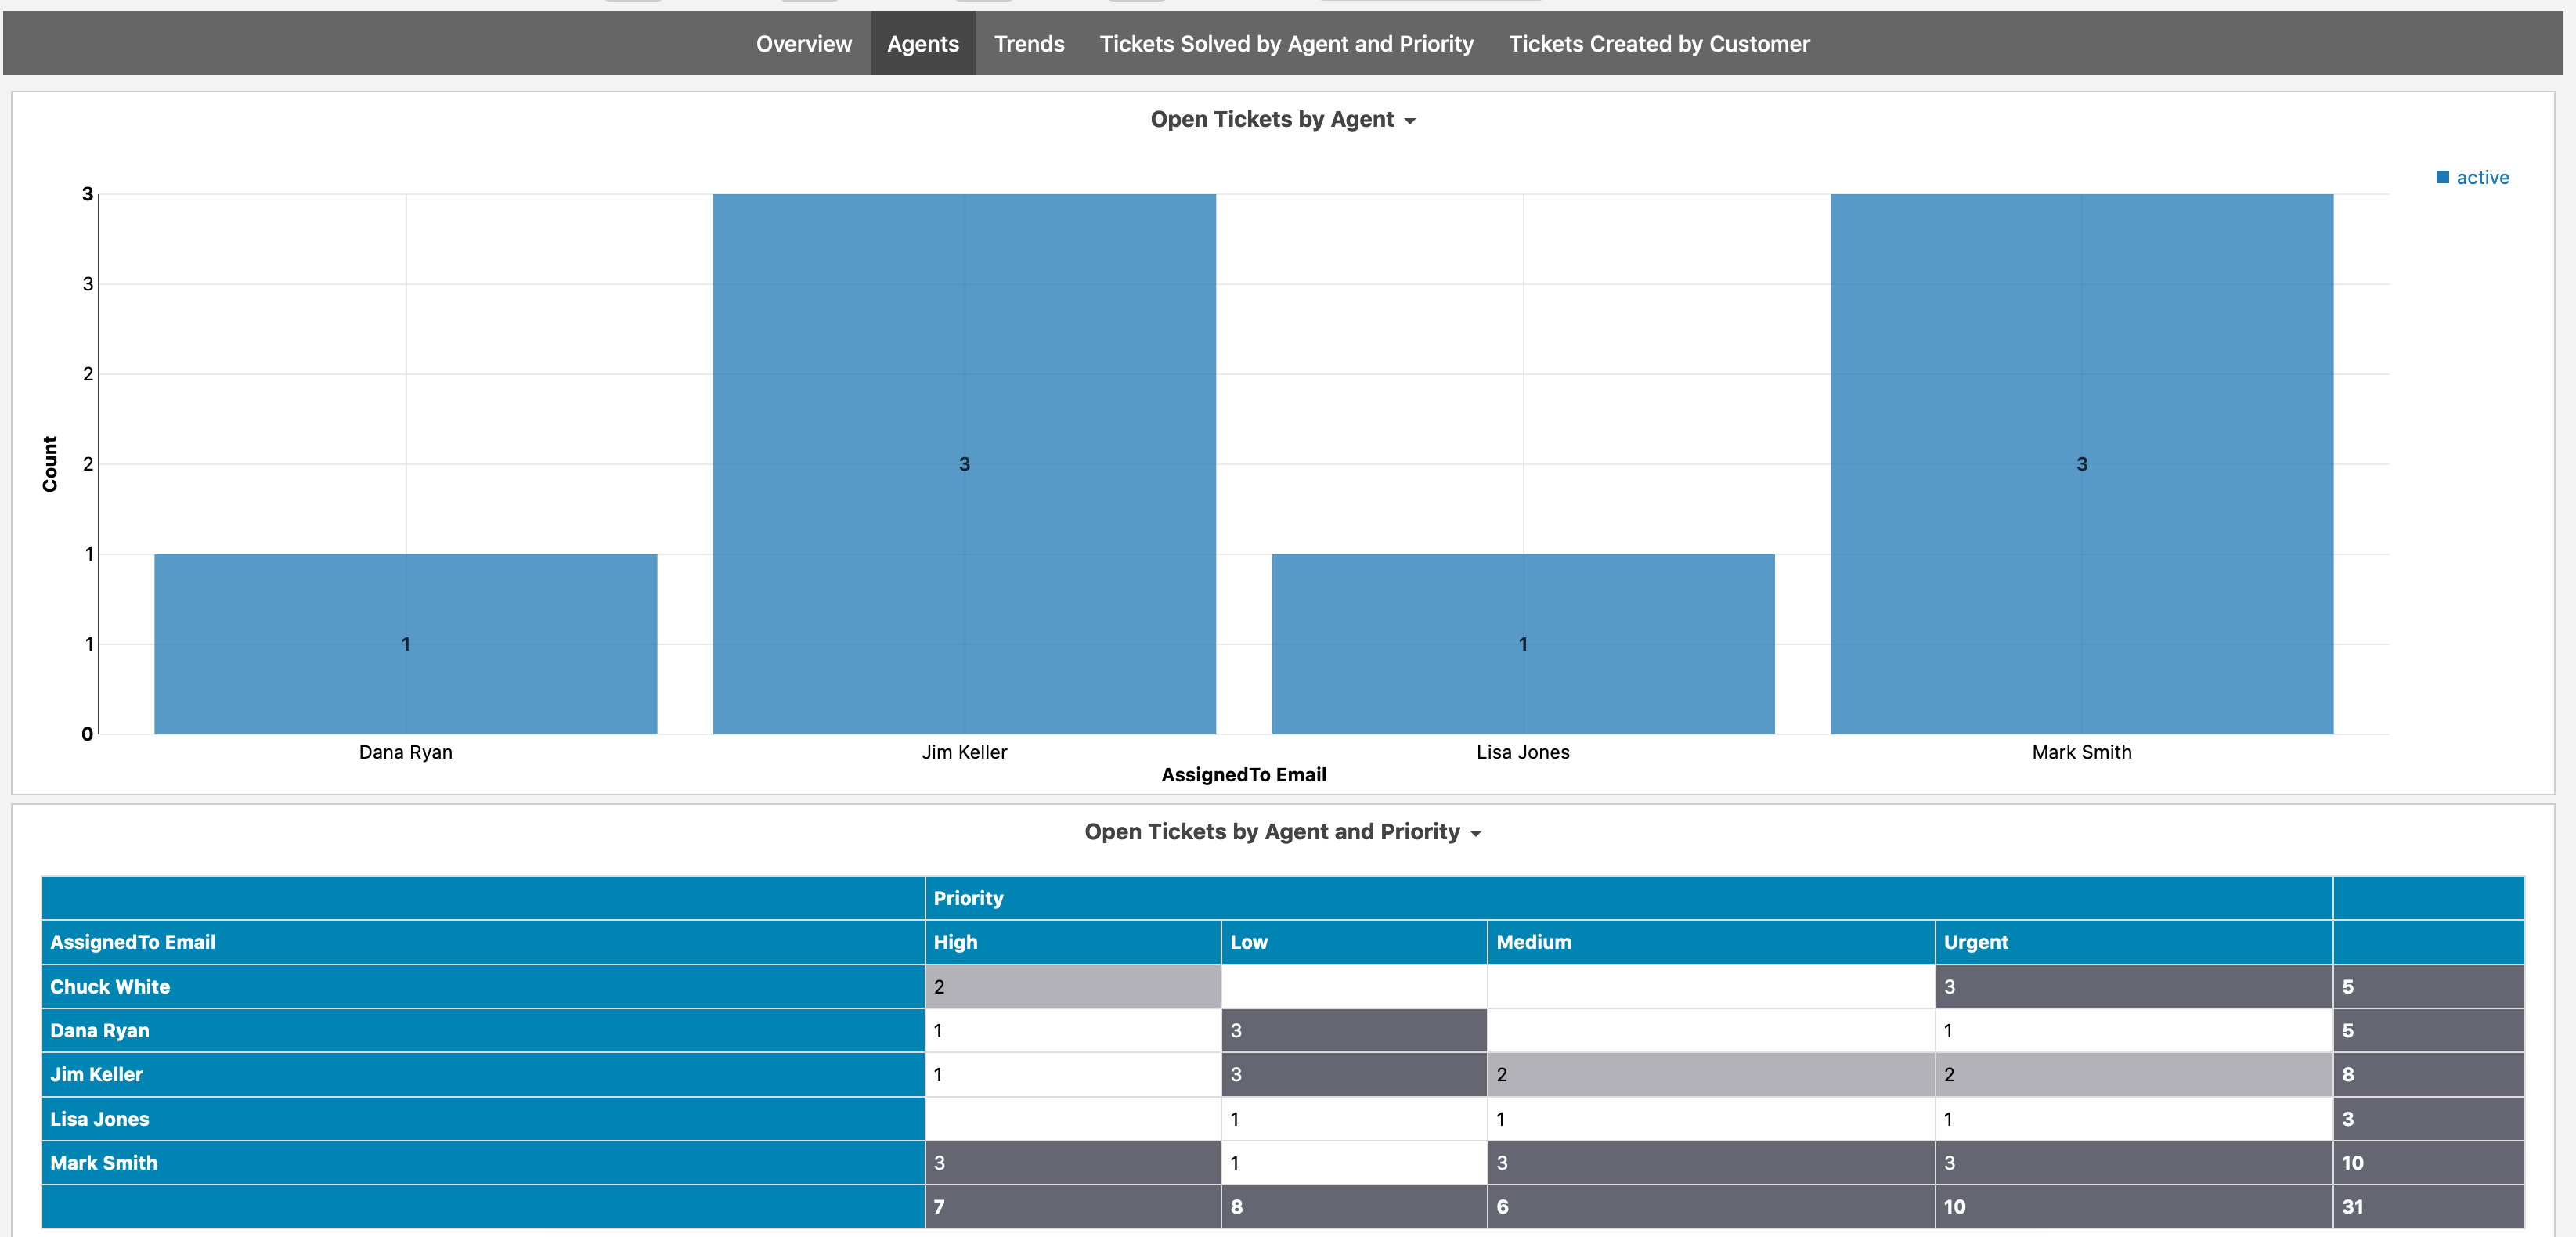
The Agents tab gives you an open tickets by agent chart. The Open Tickets by Agent and Priority and Agent Tickets Solved by Month give you crosstabs with the highest values given the darkest shading. Time to Resolve and Time to Respond are shown at the bottom per agent as charts.
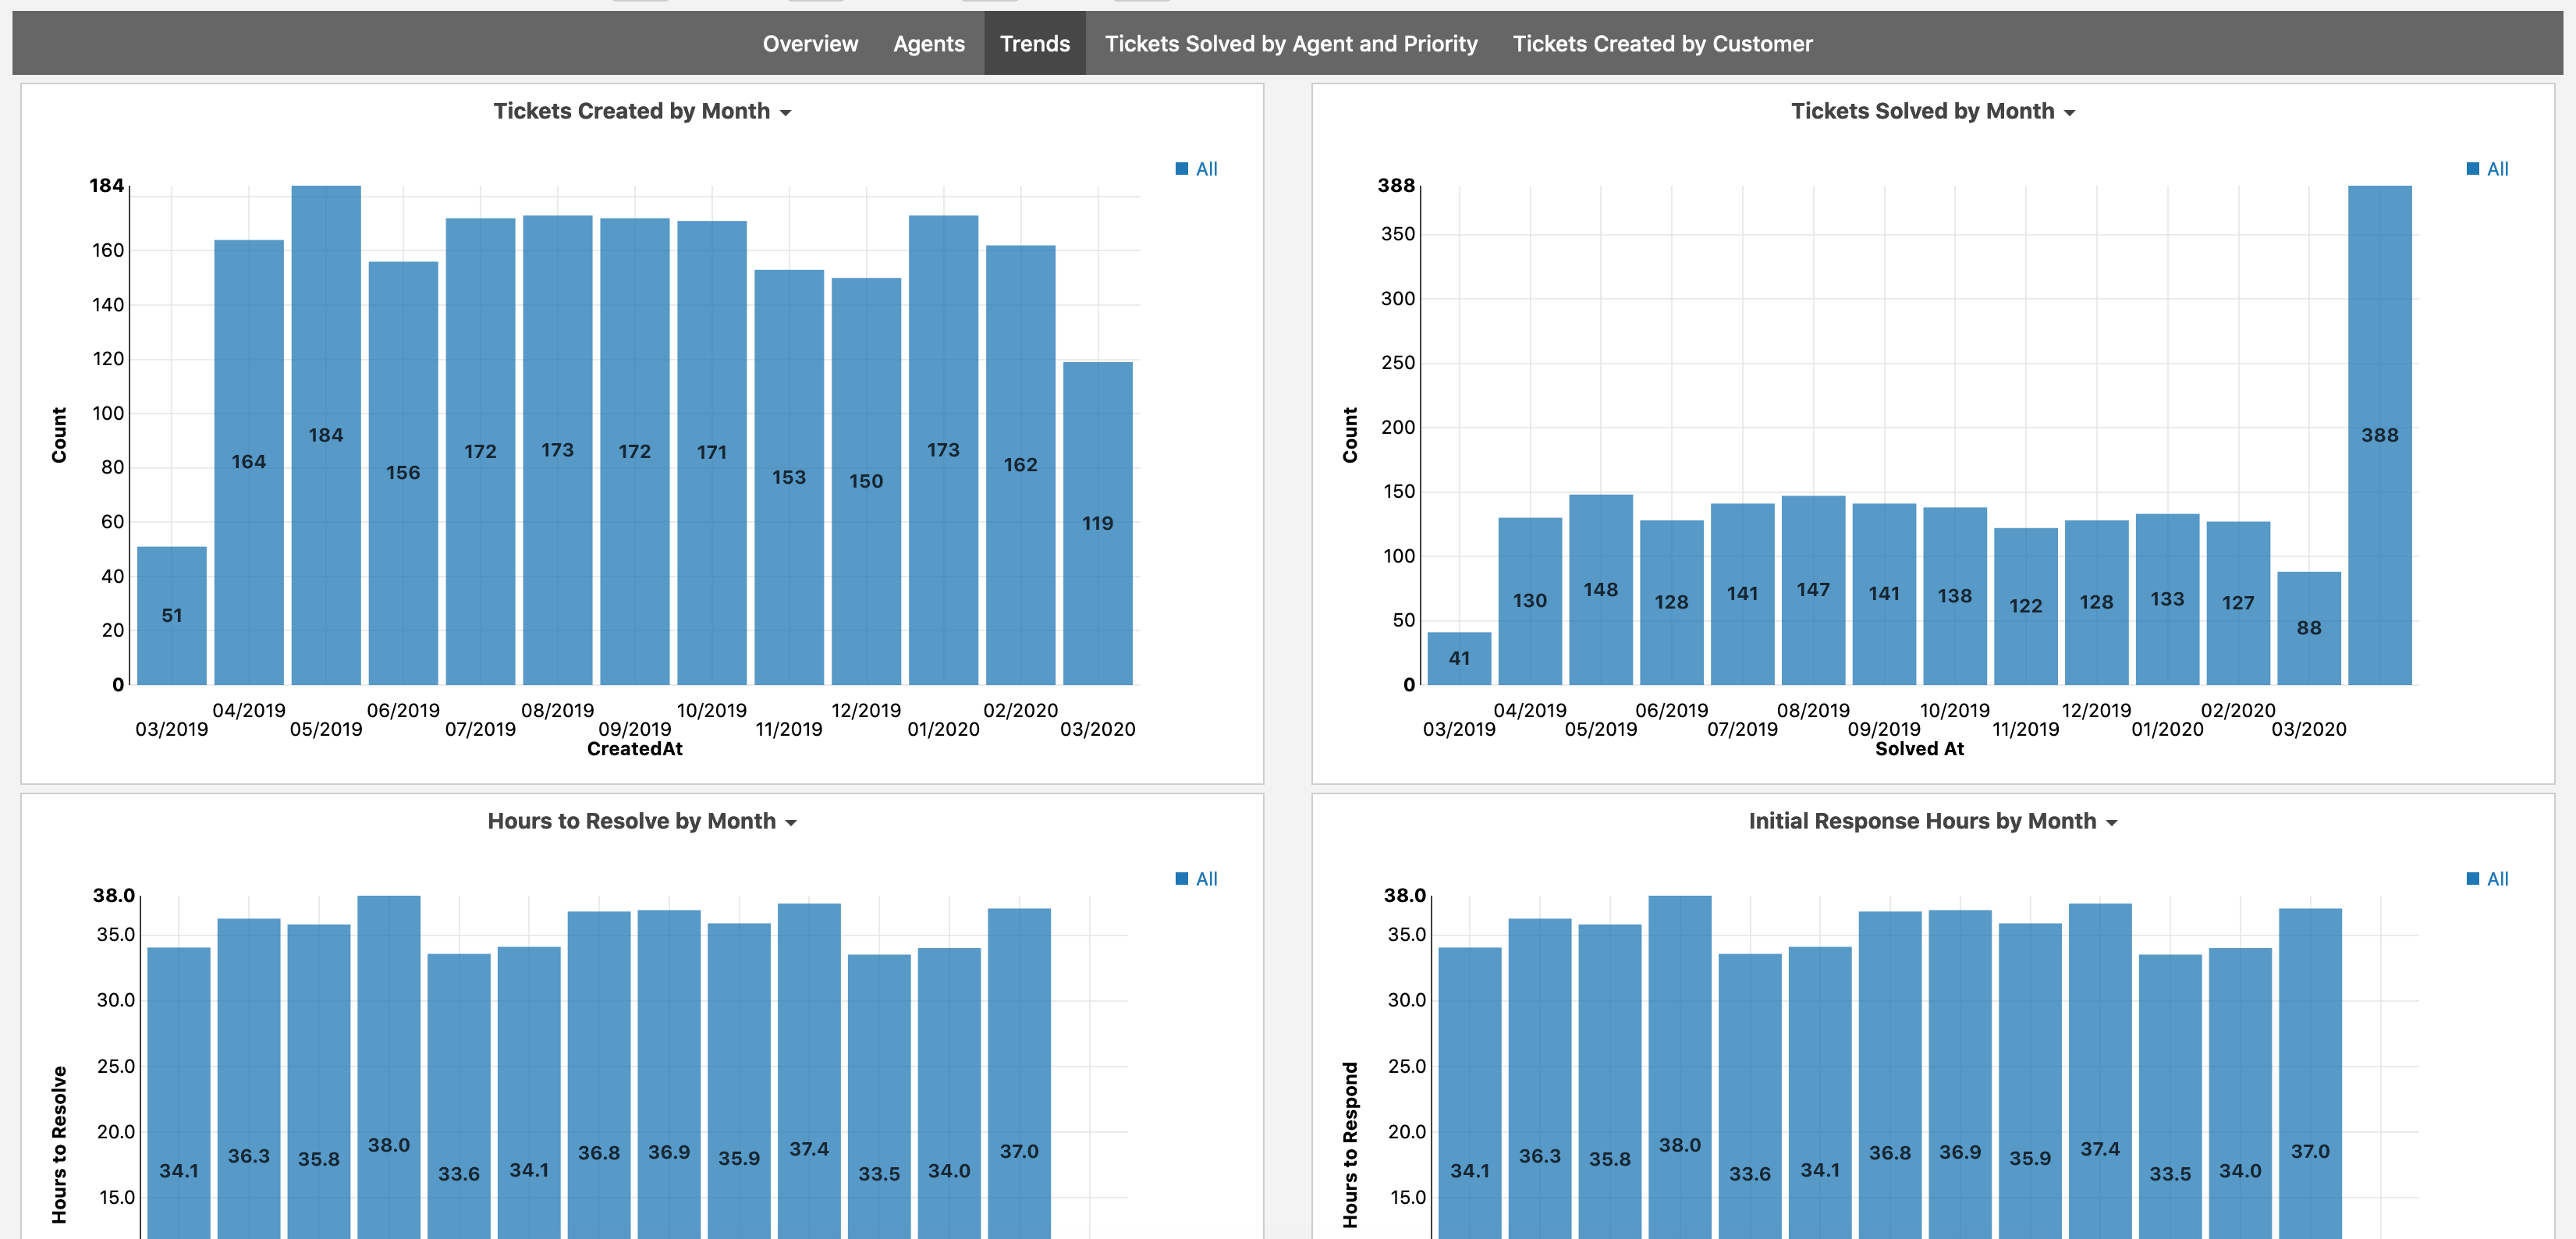
Trends shows you tickets created, solved, hours to resolve, and initial response hours by month, helping you to understand performance trends.
Tickets Solved by Agent and Priority gives you a tree of tickets by agent and priority. You can open up a given agent level to look at the tickets by priority. The columns show the results month over month.
Once enabled, you should have an 'Active Tickets' report. You can click on Add Ticket at the top of the report to add a new ticket, or change the various fields of the ticket through the report.