Easy Insight Logo
Call 1-(720)-316-8174

Calculating Net Profit

You can use Easy Insight to accurately calculate profit down to an order line level, factoring in not just the COGS from your inventory system but also actual shipping costs from your shipping system, channel marketplaces fees from your e-commerce system, and any additional costs such as advertising or warehouse expenses that you want to allocate across orders.

For each inventory management connection in Easy Insight, a set of prebuilt reports under the 'Margins' section shows you the number of orders by gross margin range, the number of orders by net margin range, the margins by channel, and the net profit by sales channel and month. You can use these reports to identify which particular sales channels or orders might be coming in at a negative net margin or find which particular combinations of products and channels are the most lucrative for your business.

We break up costs by the following categories:

  • Discounts -- how much of a discount was applied to the sale?
  • Credits/Returns -- how much has been credited back to customers?
  • COGS -- how much has it cost to purchase or build the sold products?
  • Shipping -- how much has it cost to ship orders?
  • Channel Fees -- how much has it cost to sell on e-commerce channels?
  • Variable Expenses -- what other variable costs such as warehouse salaries, advertising, and sales commission are affecting your bottom line?

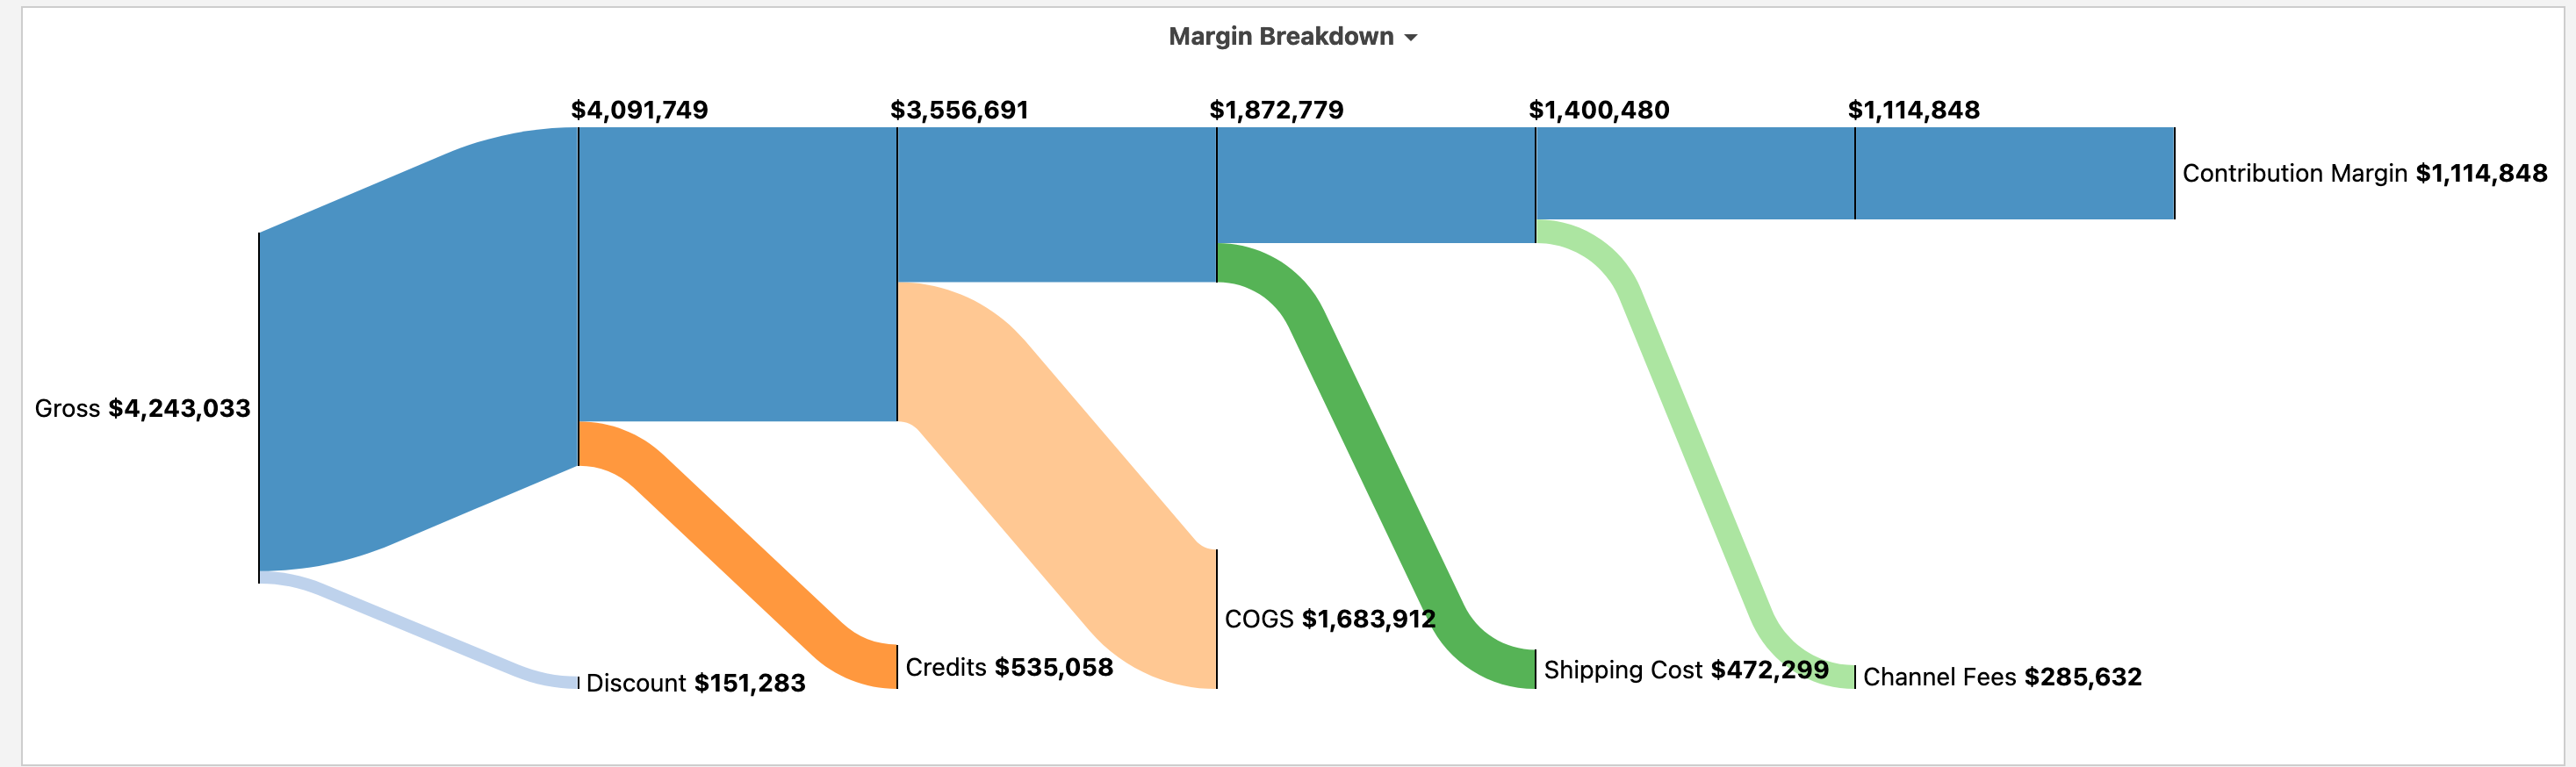
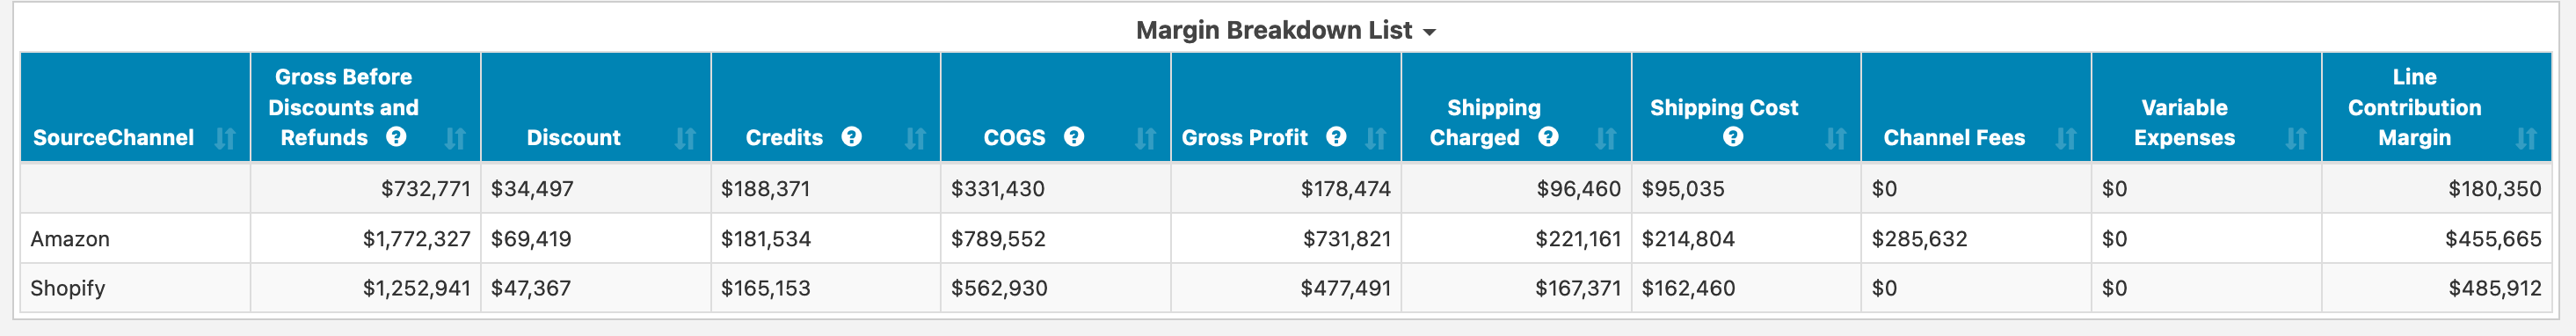
In general, discounts, credits/returns, and COGS can come out of the inventory management system itself. Shipping costs are typically pulled from the shipping system such as ShipStation or StarshipIt. Channel fees are pulled from the e-commerce channels such as Shopify, Amazon, Walmart, or Etsy. Variable expenses are pulled from the accounting system such as QuickBooks Online or Xero. For more information on connecting external costs to your inventory management system, please see Extending Inventory Data.

Across the different inventory management system prebuilt dashboards in Easy Insight, we've tried to show the same general set of reports:

The Margin Breakdown provides a sankey chart starting with gross sales and shipping charged to the customer, then subtracting discounts, COGS, shipping, channel fees, and variable expenses to get your end contribution profit.

Margins

The Margin Breakdown List a table of the same data, but with the ability to compare profit details between source channel, product category, or other fields.

Margins

# of Orders by Gross Margin Range and # of Orders by Contribution Margin Range give you the # of orders in each profit range. You can click to drill in and find orders with < 0% or other less than ideal ranges to try and figure out what needs to change in your business.

Margins

The final displays of profit by sales channel and and profit by category let you visually compare gross and contribution profit across sales channels and category.

Margins
RESOURCES
Twitter Logo