Are you a design firm, tracking projects from kickoff through client approvals through launch? Do you manage solar installations, from order through installation? Processes in Easy Insight take advantage of common tasks, cards, or tickets across your project management system and make it easy to visualize what's happening and what's happened, all with a minimum amount of setup work.
To start with, you'll need to click into your data source from the Home page. Once you've done that, you'll see this link in the upper left corner of the screen:

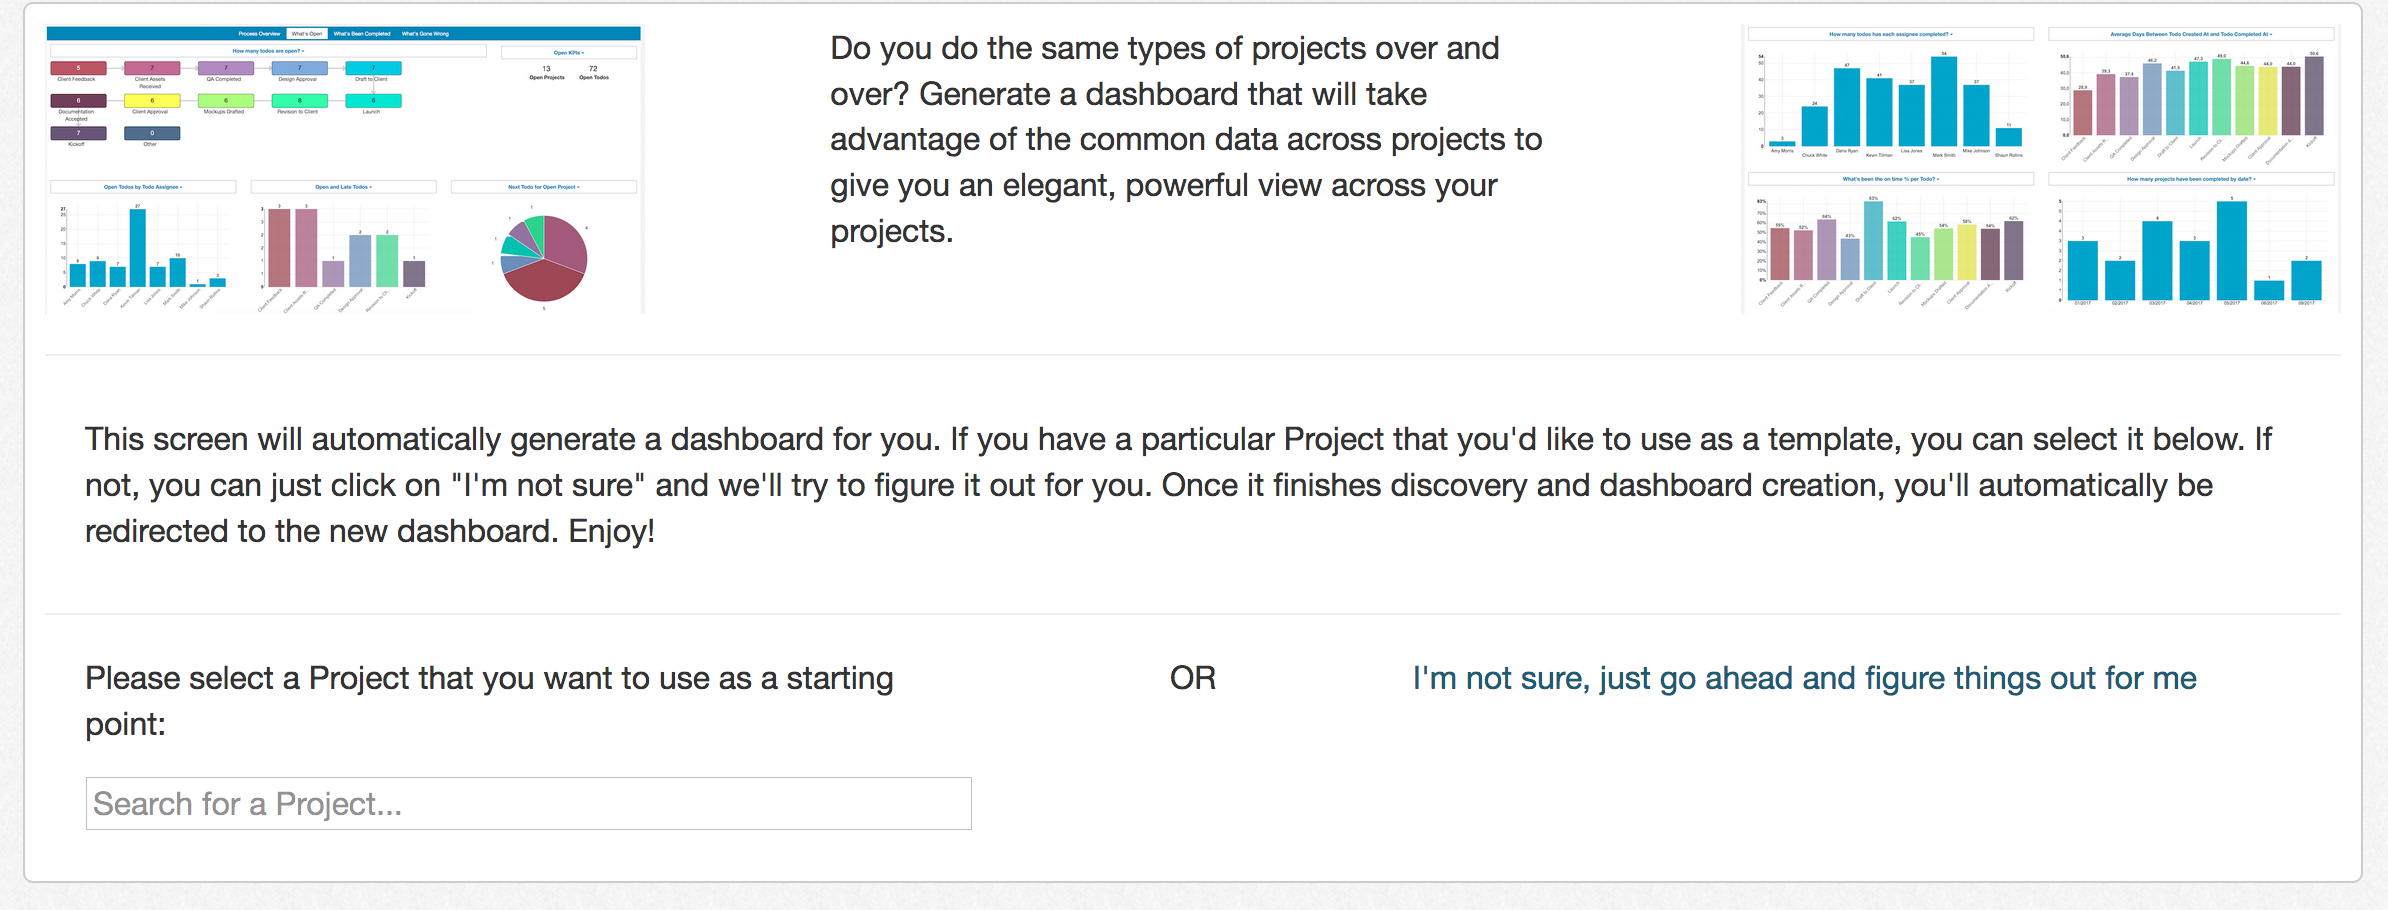
Go ahead and click on this link. It'll take you a new screen that should look something like the following:

Depending on the specific connection you're using, it'll typically prompt you to select a project or a board that you want to use to help auto discover a business process. If you have a particularly "typical" project in Basecamp, Teamwork, Redbooth, or Asana, one that best exemplifies your business, select it here. If you're reporting on Trello, select the board that you feel is most important. If there isn't really a project or board that fits, you can click on "I'm not sure" to just go ahead.
If you're using Teamwork, Basecamp, Asana, or Redbooth, auto generation of the process and dashboard will start as soon as you make a selection. If you're using Trello, you'll be prompted to choose an "end" to your process. Which list on the board you selected indicates that a card has been completed? Once you've made that selection, auto generation of the process and dashboard will start.
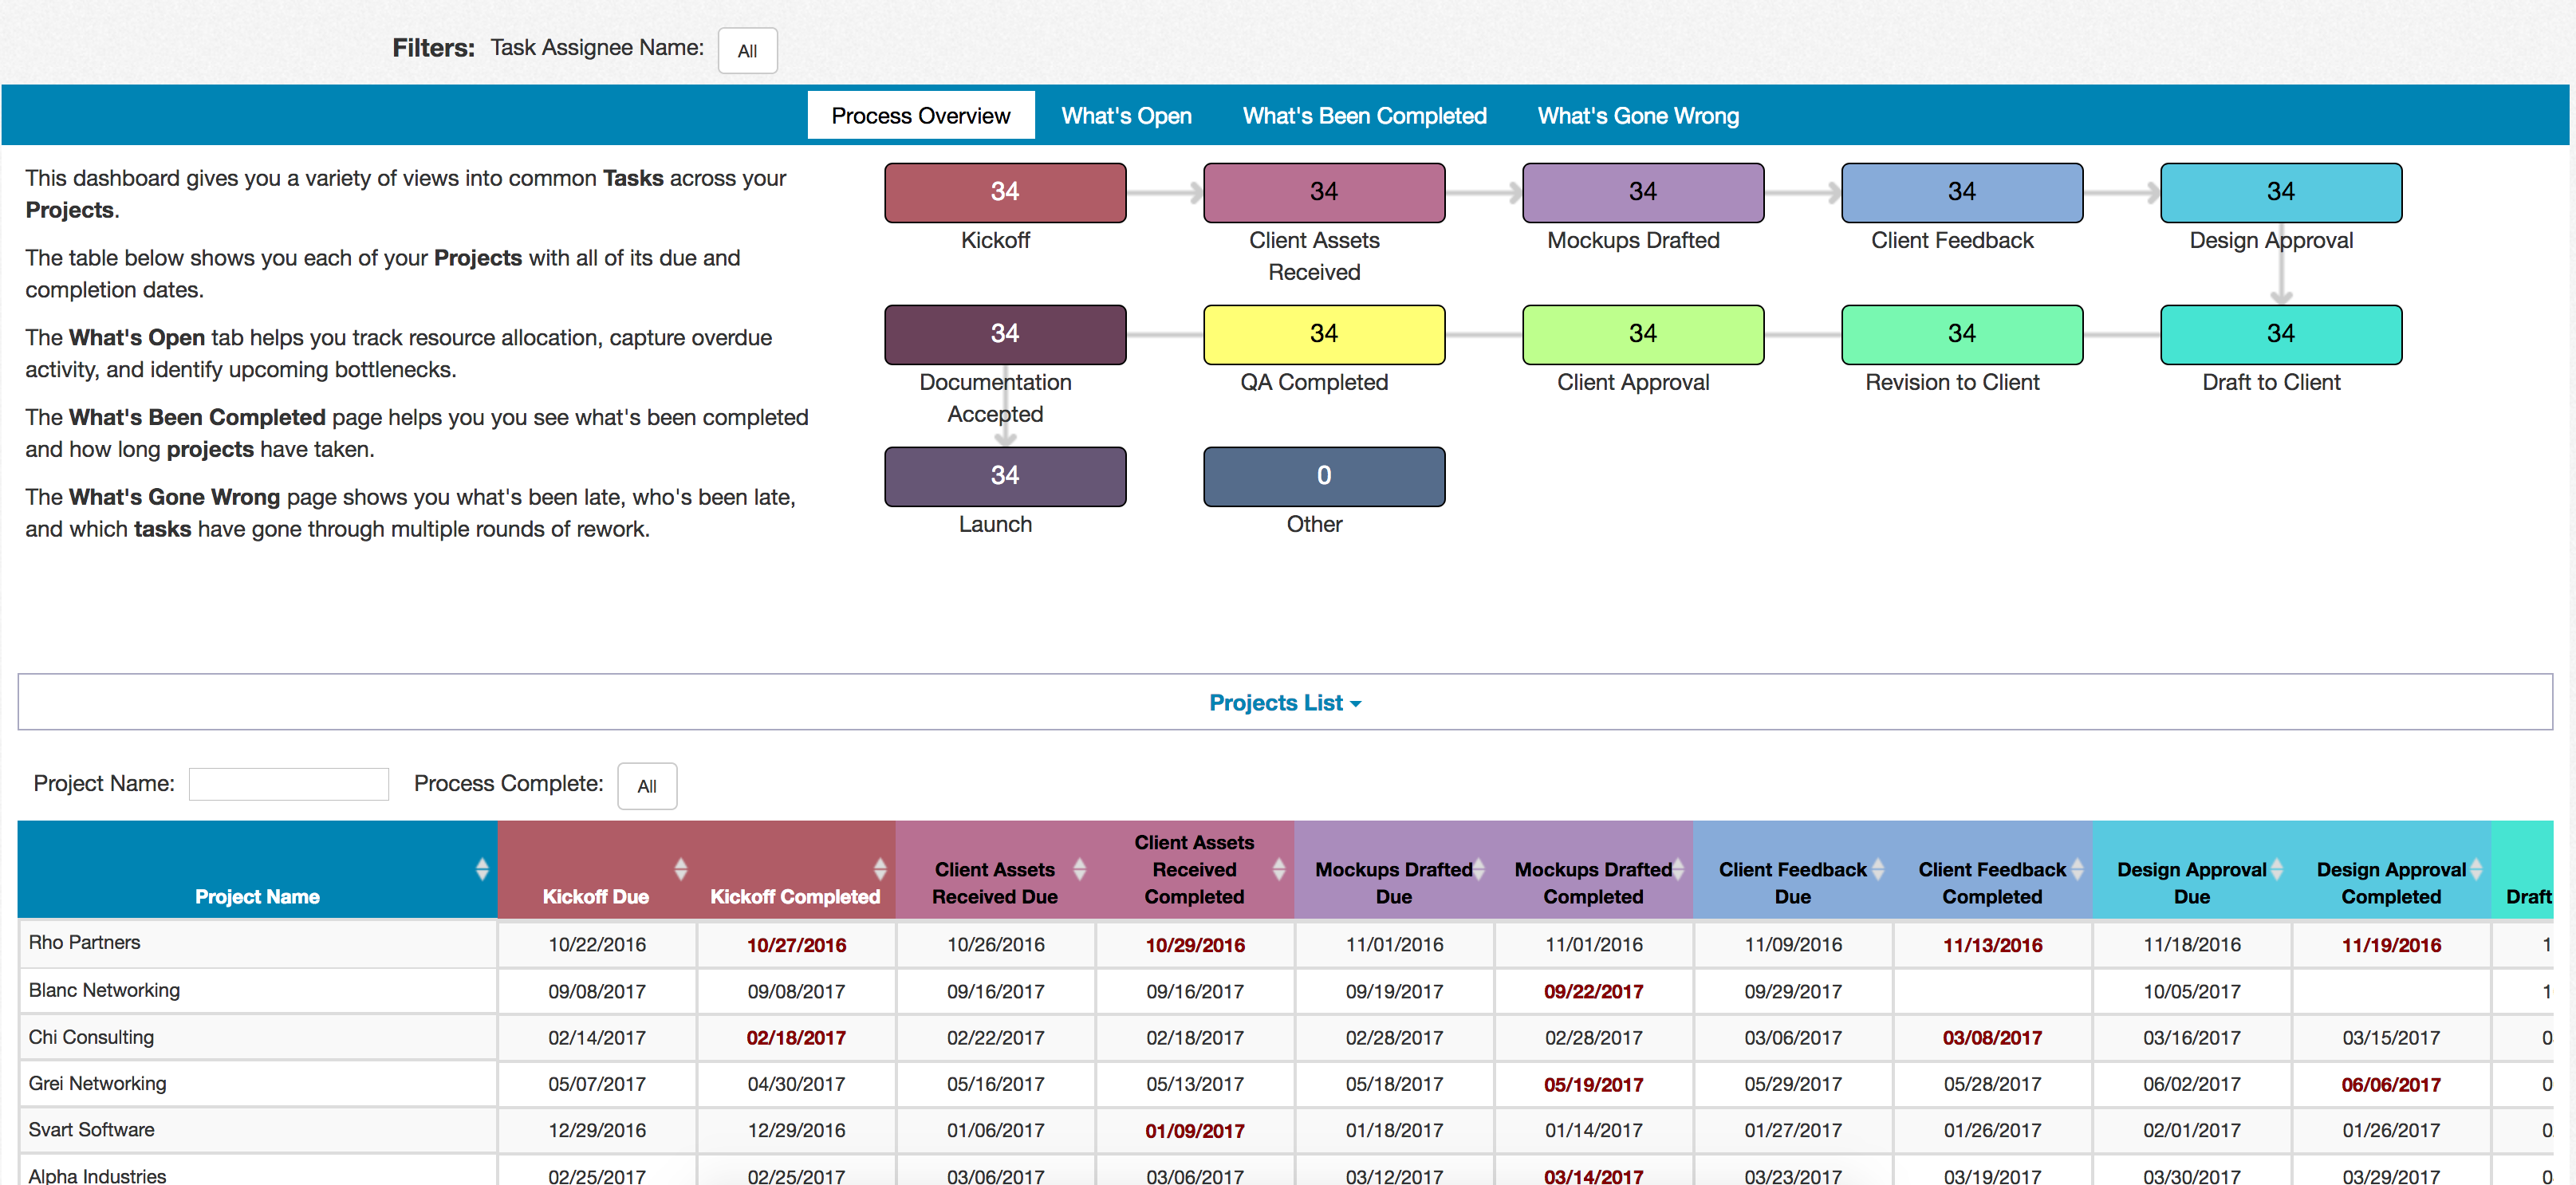
Once it finishes the auto generation, you'll be redirected to the new dashboard, which will look something like what you see here:

You can click on the values in any of the reports to drill in for more details. While auto generated, the dashboard and all of the reports can be further customized through the usual report editing capabilities of Easy Insight.
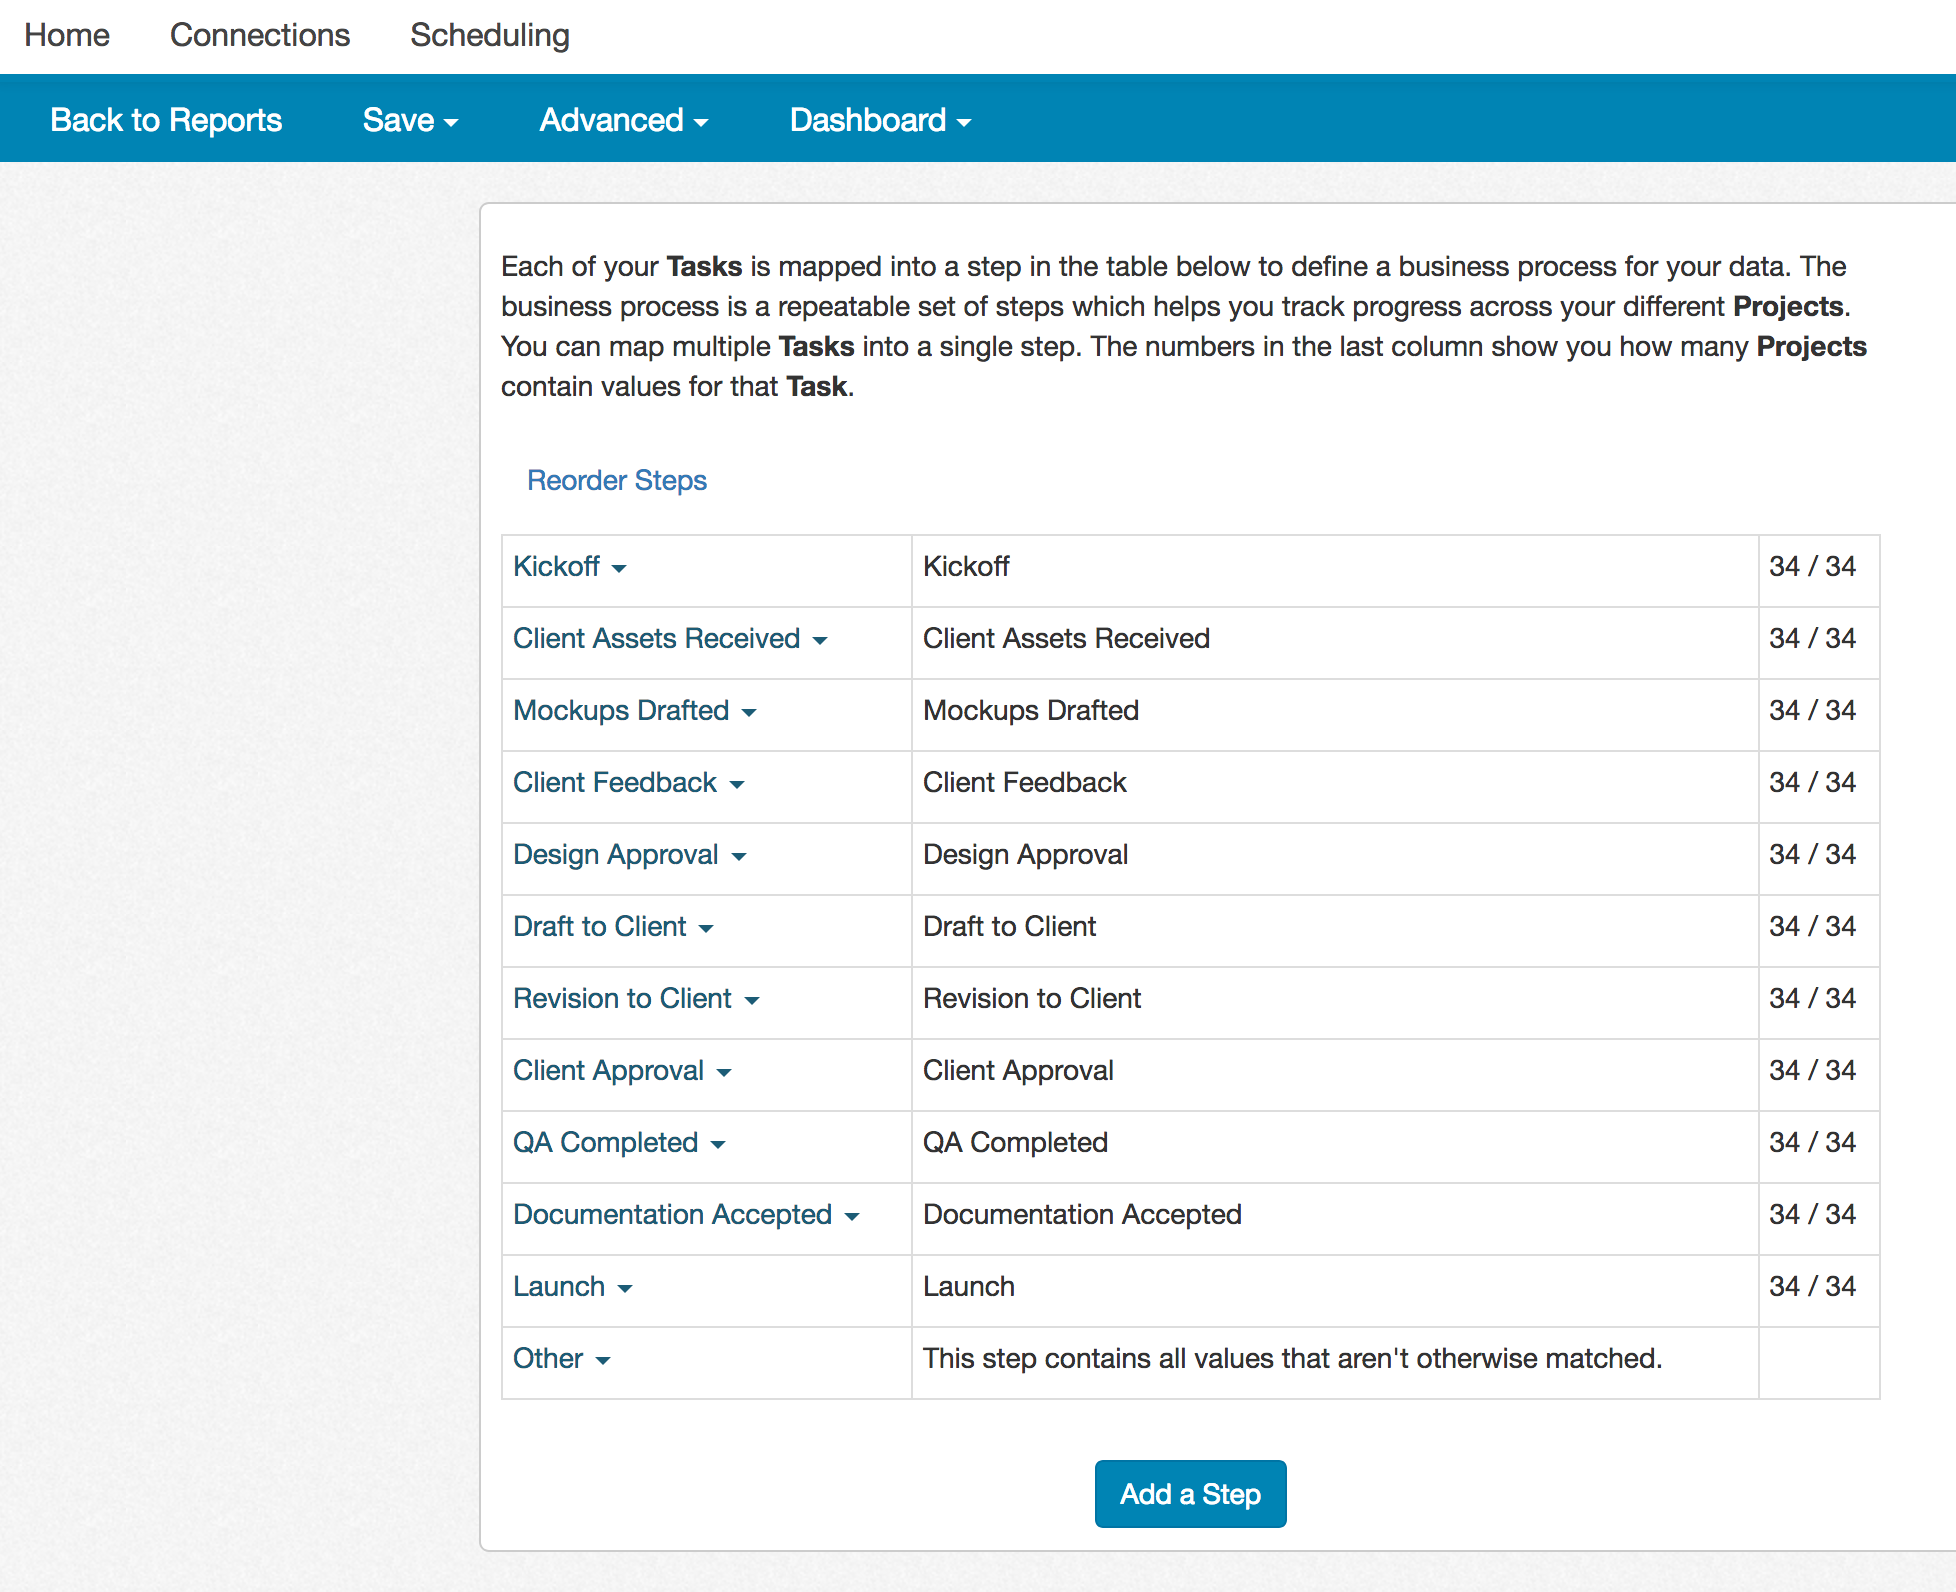
To further customize the process, you can click on "Edit the Process" in the upper right corner of the dashboard. That will take you to the process editor, as shown below:

On this screen, you can make further changes to the particular tasks or board columns used.
If you want to add a new task or column that's not present at all in the list of steps, you can click on "Add Step" at the bottom. It'll pull up a list of tasks or columns that aren't already in the process, ordered by how often they occur across your data source. Clicking on a value will add it to the process as a new step.
Next, you might have multiple names that you want to consolidate into a single step. For example, you might have projects where the first todo name is Kickoff, Kick Off, or Kick-Off, or you might have board columns of Done, Finished, and Completed on different boards, all of which really represent the same business process step. Add one of the values if it's not already present, then click on the step name and choose "Edit the Step". Here, you can rename the step as well as add additional values in the same way that you can add a new step. Map in the other values and they'll all show together in the dashboard as that single labeled step.
If you need to change the order of the steps in the process, you can click on "Reorder Steps" at the top and drag steps around to establish a new order.
Once you've made any necessary changes, click on the "Save" button in the upper left. You can click on Dashboard and choose your dashboard to navigate back to see the results of your changes.