Easy Insight Logo
Call 1-(720)-316-8174

Trend Grid Reports

A trend grid report shows values per the selected grouping, with additional configuration to help you track % change over time.

Trend Grid Sample

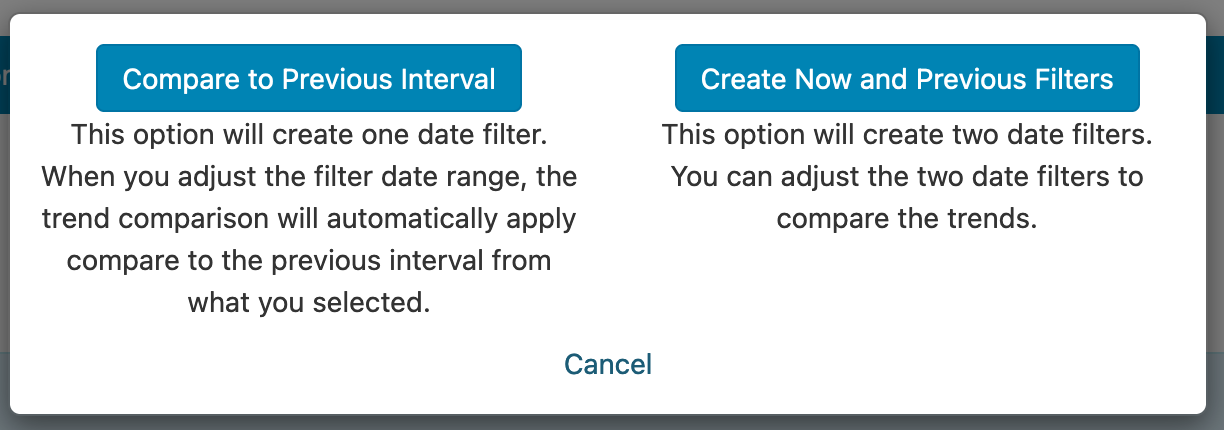
When you first create a trend grid report, you'll see a 'Set up trend filters' option in the report editor. Click on this link to set up the filters that will drive the trend comparison:

Trend Grid Sample

You can choose to create one filter and have it automatically compare to the previous interval or multiple intervals, or you can create two filters for comparing two explicit time periods.

Trend Grid Sample

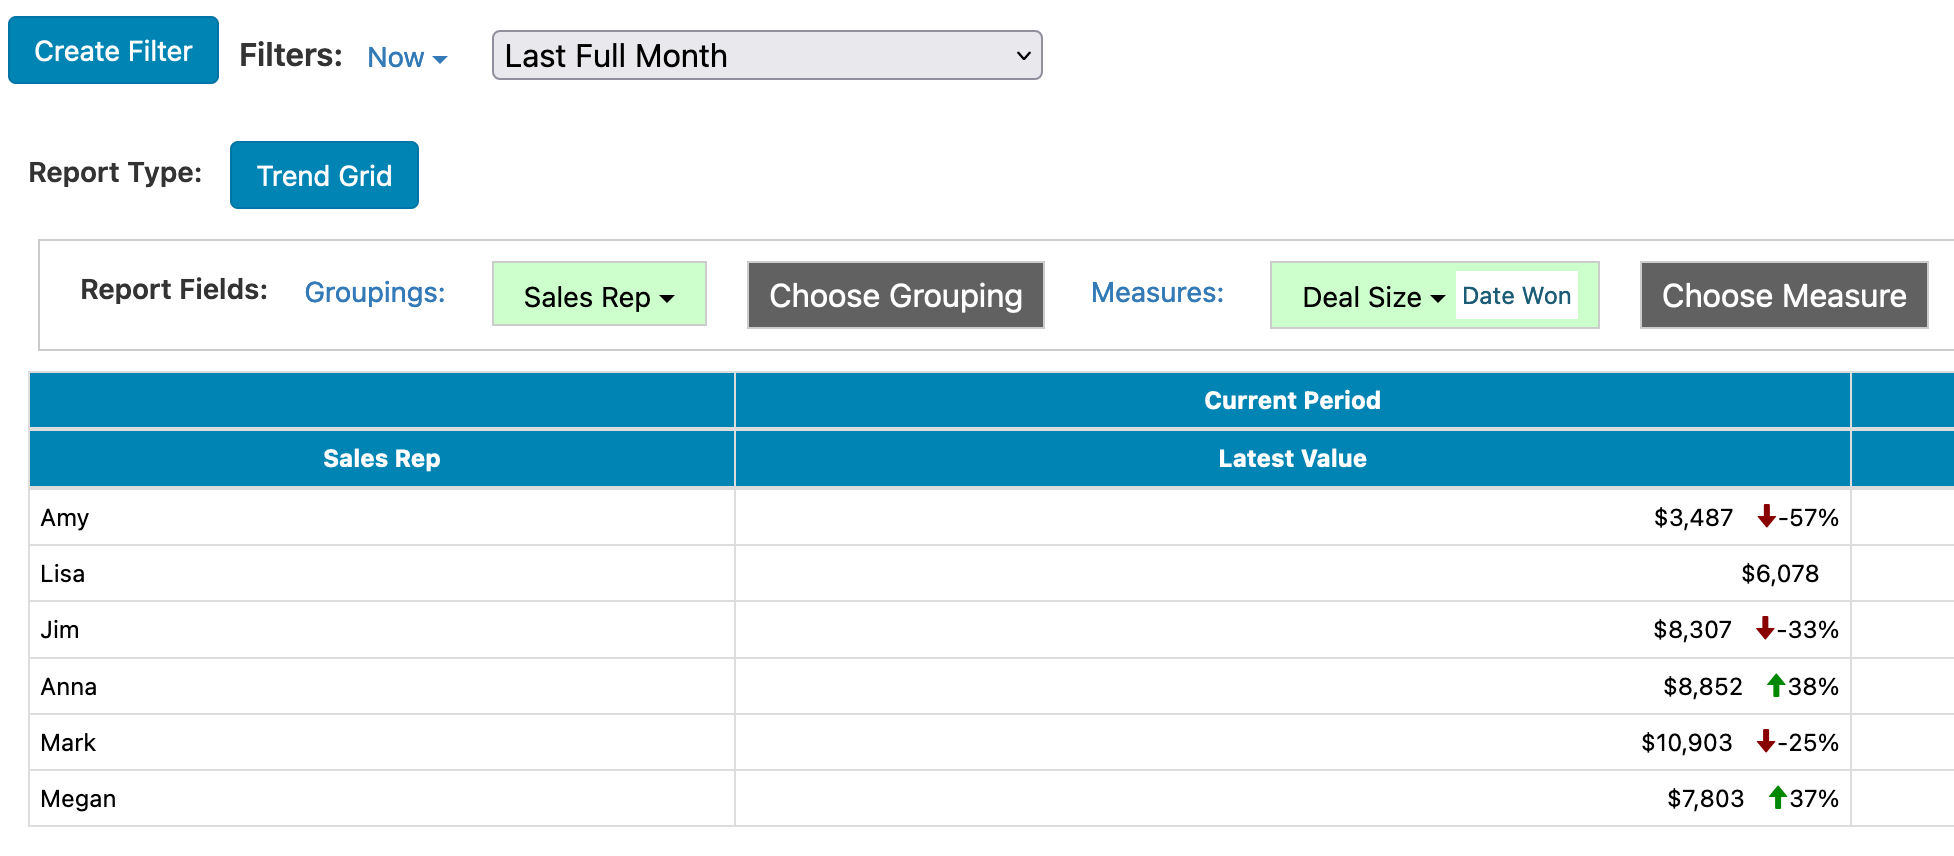
Once you've set up your date filter, you can add your grouping and measure to the trend grid--in the example below, Sales Rep and Deal Size. The last step is to set up the date field used by each measure in the report. Click on 'Select Trend Date' next to the measure and choose the appropriate date field--for example, if we're comparing by when the deal was closed, we'll use Deal Close Date.

Trend Grid Sample

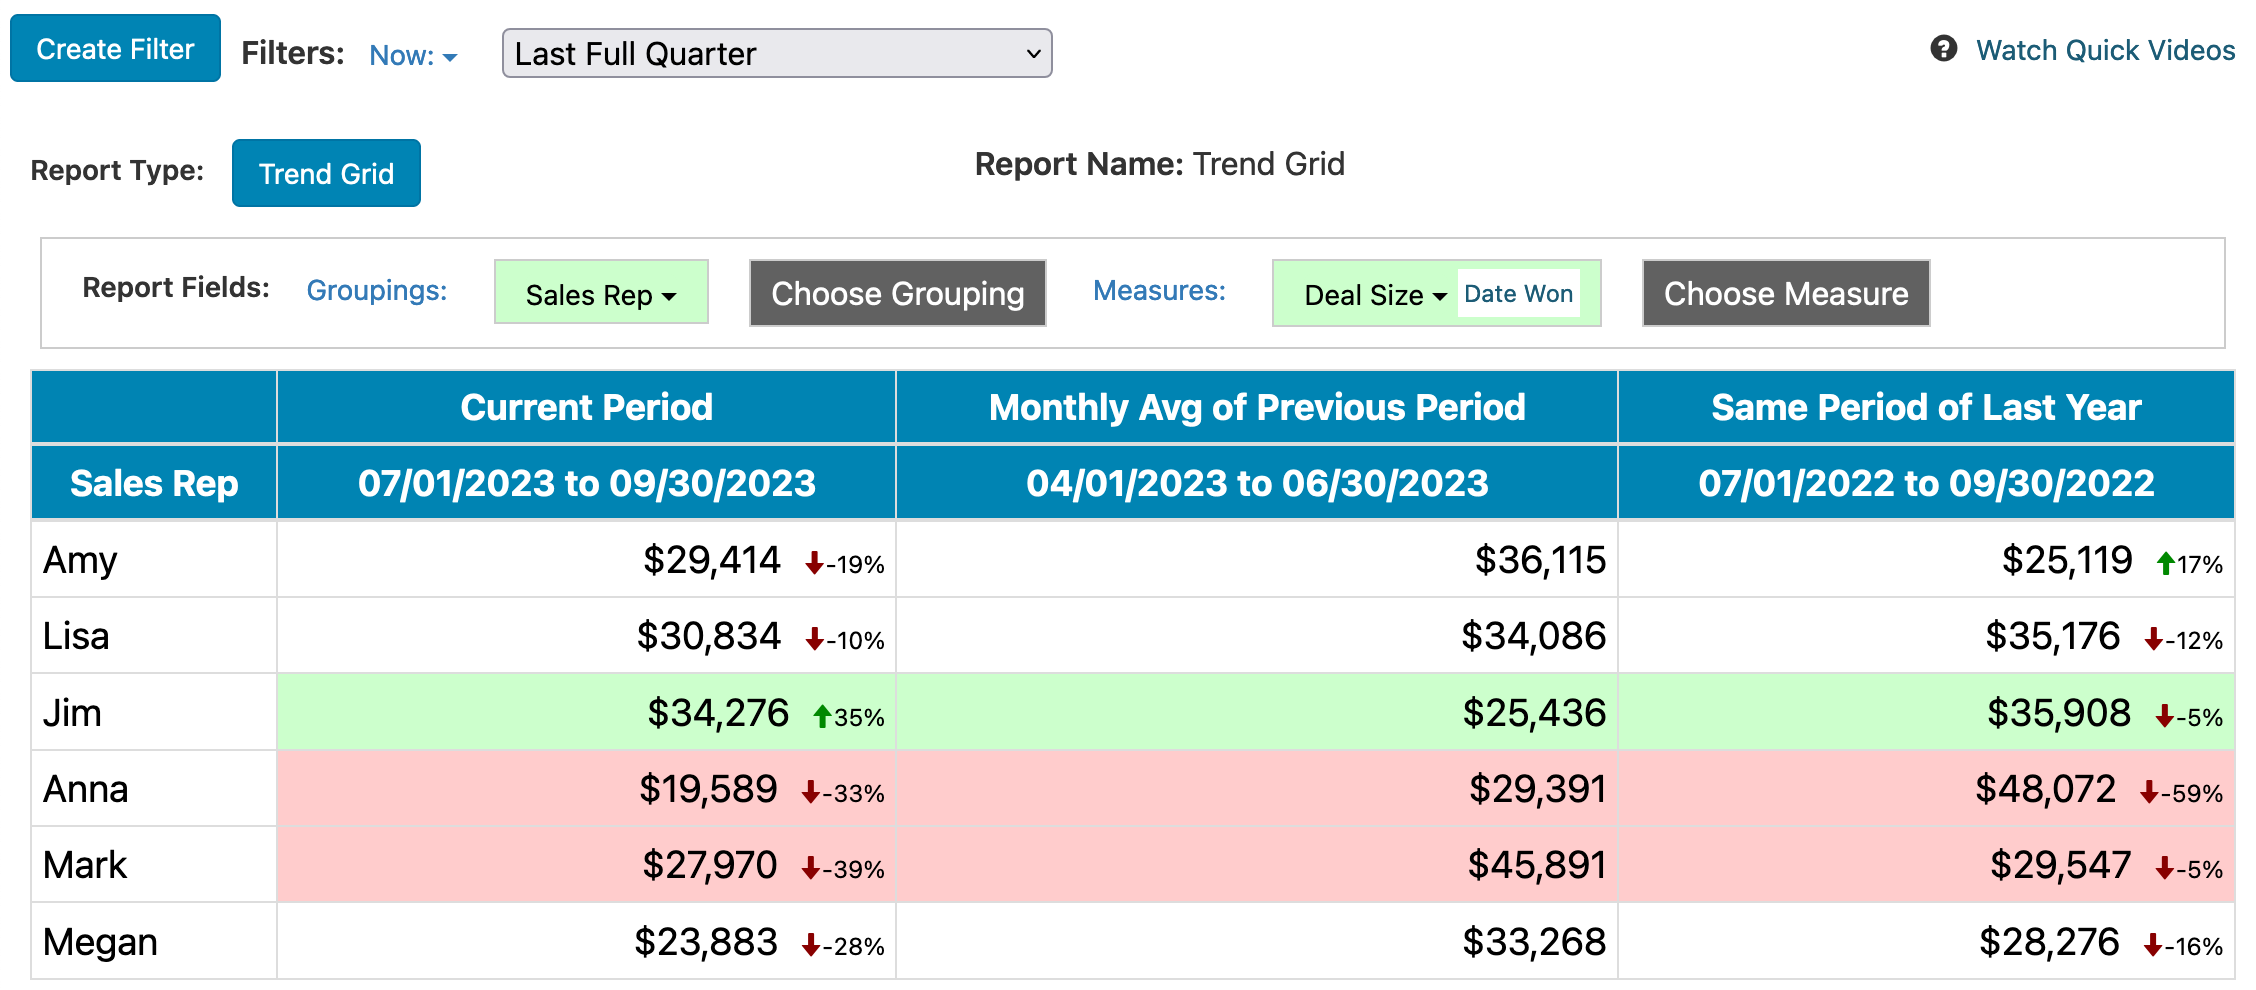
Once you have your report configured and a time period selected from your filters, you'll see the trend comparison:

Trend Grid Sample

Under Configuration -> Report Properties -> Formatting, you'll find a number of options for customizing your trend grid:

  • Font Size -- the font size used for the main numbers in the report.
  • Header Font Size -- the font size used for the table headers.
  • Comparison Font Size -- the font size used for the trend comparison percentages and icons.
  • Previous Intervals -- if you're automatically comparing to the previous time period and put in 2 as the previous intervals, the previous value will contain the average of the last two intervals. For example, if your filter is the last full month, it would compare to the average of the previous two months.
  • Error on Comparison Range -- if the trend is worse than this percentage, highlight the row's background color in the color selected under Error Color
  • Good on Comparison Range -- if the trend is better than this percentage, highlight the row's background color in the color selected under Good Color
  • Last Year -- add an additional column to compare the same time period in the previous year
Color Scheme Properties

The following properties are set in the Report Editor -> Additional Configuration -> Edit Properties -> Color Scheme.

  • Color Set: This property determines which color scheme is used in the report. When set to Primary or Secondary, it will use the colors defined in your Account Skin in the Account section of the application. If you set the property to None, you can customize the color scheme for the report.
RESOURCES
Twitter Logo