Easy Insight Logo
Call 1-(720)-316-8174

Diagram Reports

A diagram report allows you to define a process flow through connecting different measures.

When you first create a diagram, it'll prompt you to choose a field defining the end condition for steps. For example, we'll choose Deal Status to help define that condition:

Diagram Reports Sample

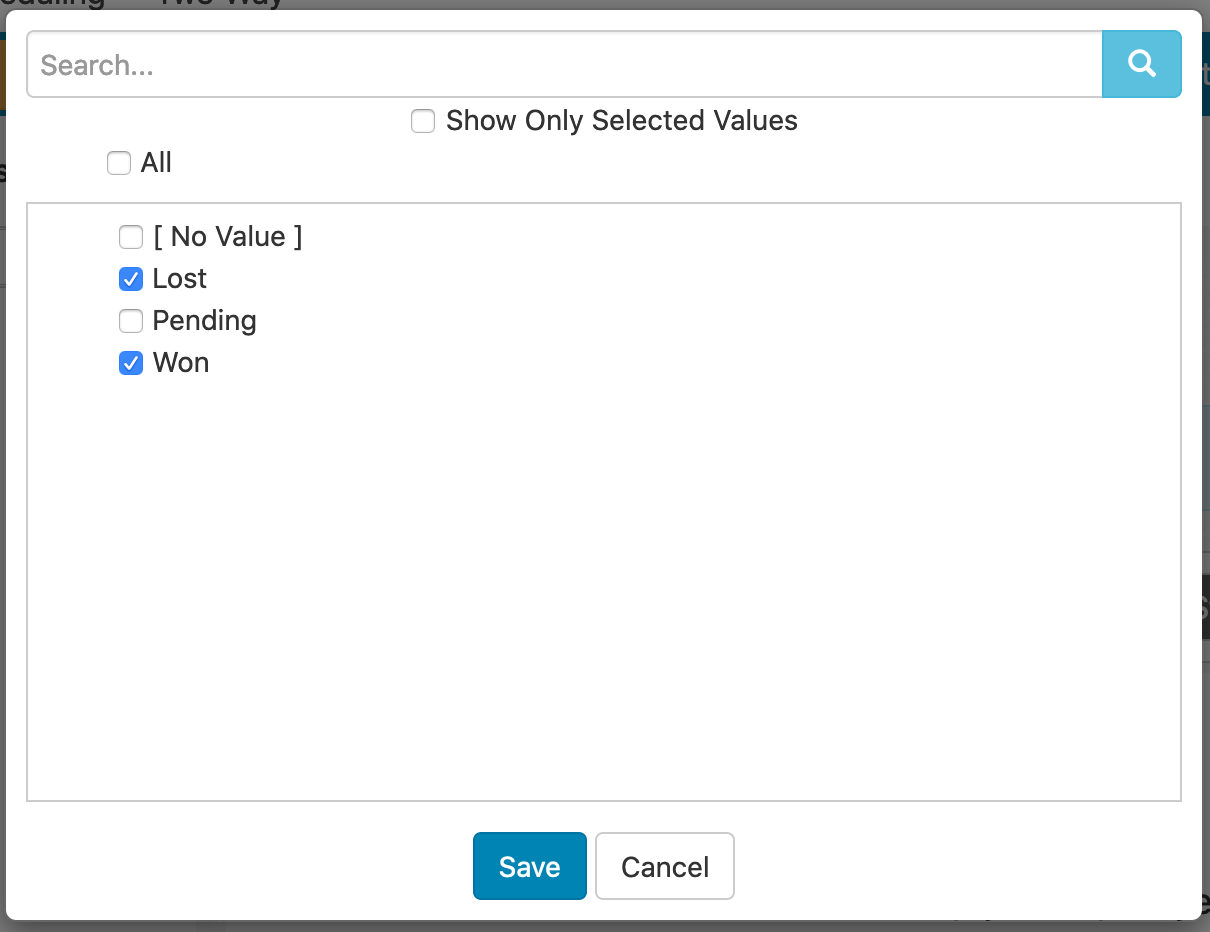
Choosing that initial field creates two filters, one for the 'in process' part of the pipeline and one for the 'end' part of the pipeline. We'll edit the 'end' filter and choose Won and Lost, to define those two cases as the end:

Diagram Reports Sample

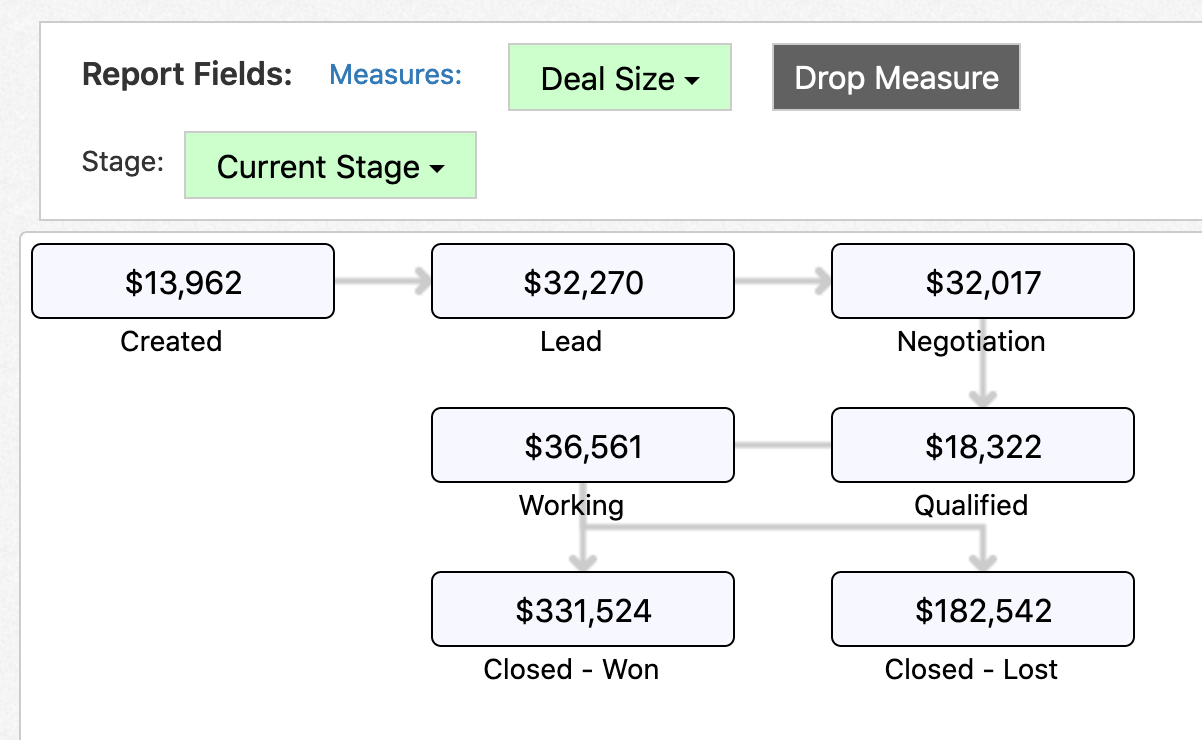
Next, we'll choose the fields going into the diagram. For this example, we'll use Current Stage and Deal Size, since we want to show deal value per stage in the diagram:

Diagram Reports Sample

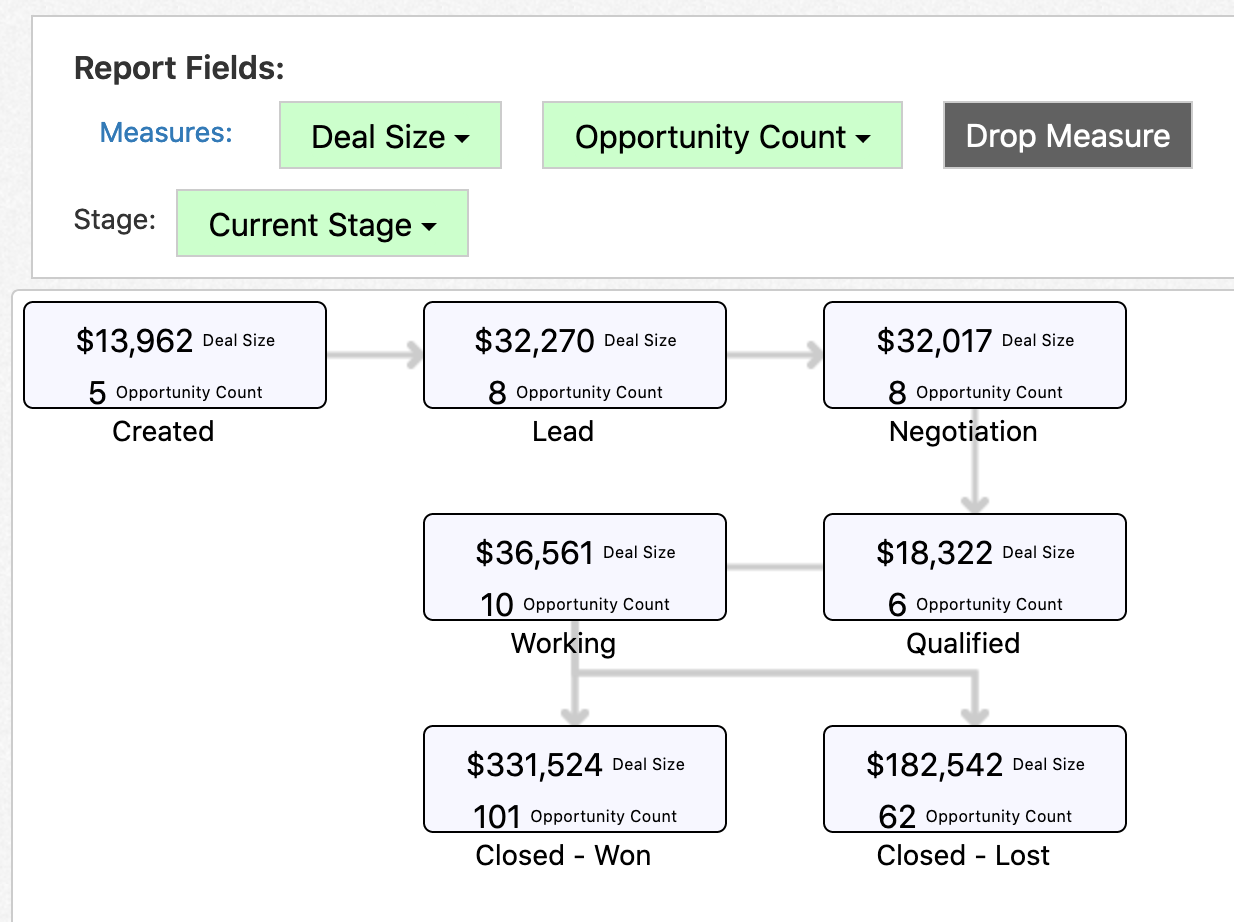
You can add additional measures to the diagram as well. For example, we can add Opportunity Count:

Diagram Reports Sample

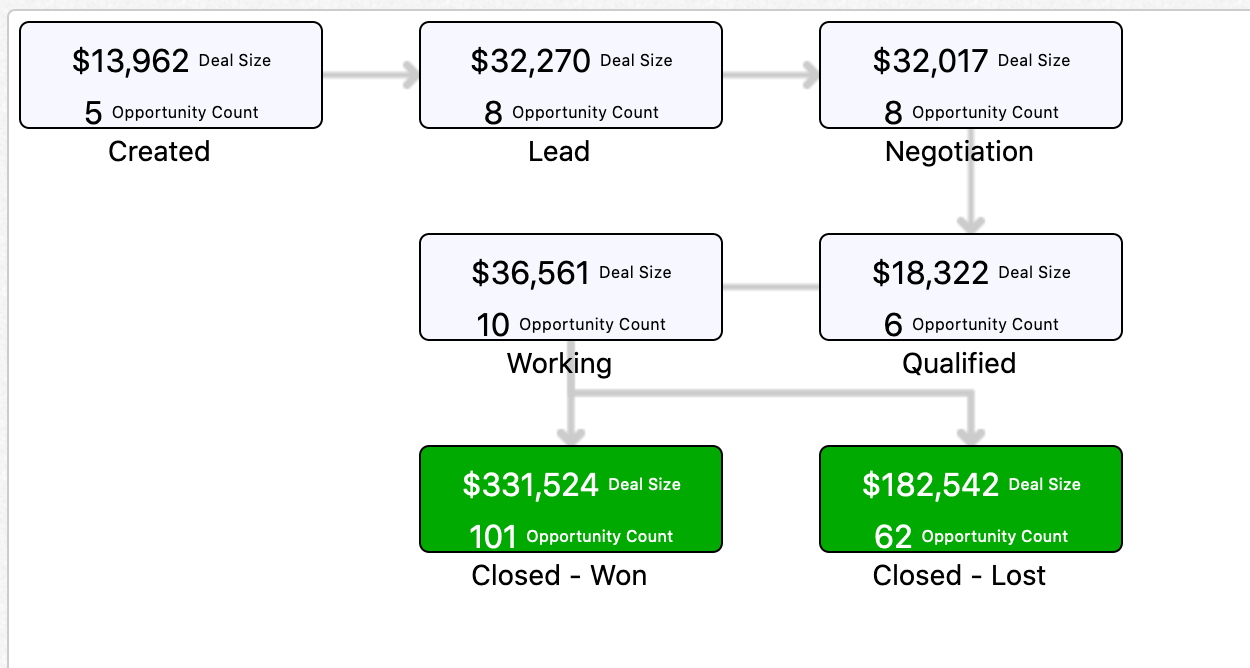
You can also set up conditional formatting on your diagram. For example, in order to show any node with more than $50,000 in sales in green, we could put in the following conditional formatting:

Diagram Reports Sample

Which gives us the following result:

Diagram Reports Sample
Color Scheme Properties

The following properties are set in the Report Editor -> Additional Configuration -> Edit Properties -> Color Scheme.

  • Color Set: This property determines which color scheme is used in the report. When set to Primary or Secondary, it will use the colors defined in your Account Skin in the Account section of the application. If you set the property to None, you can customize the color scheme for the report.
RESOURCES
Twitter Logo