Easy Insight Logo
Call 1-(720)-316-8174

Gauge Reports

Easy Insight provides three different gauge reports you can use:

Bar Chart Sample
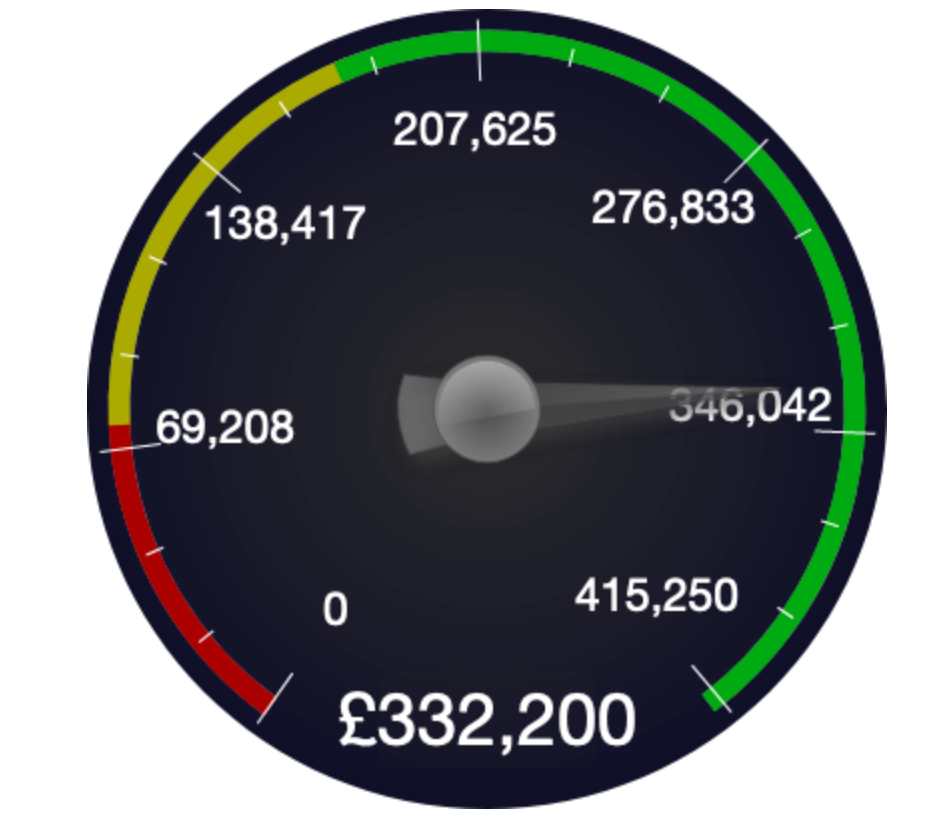
Dial
Bar Chart Sample
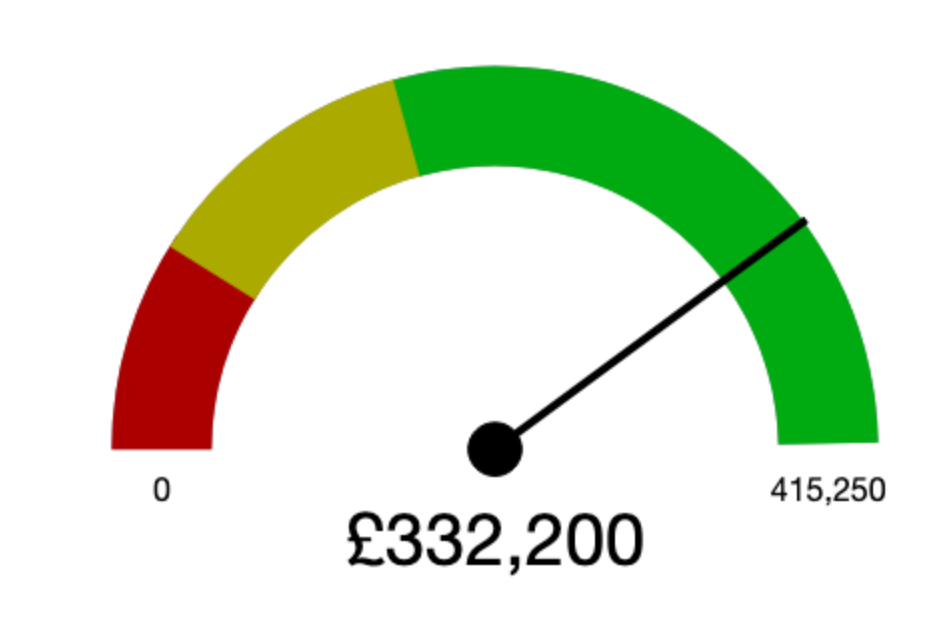
Speedometer
Bar Chart Sample
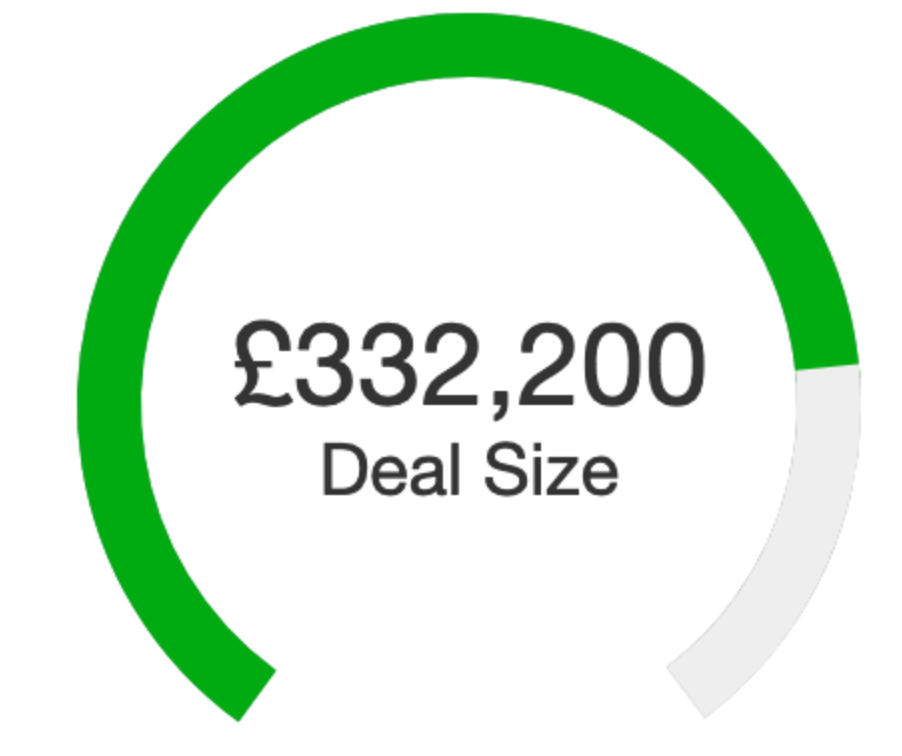
Circular

All three gauge reports are configured in the same way. Each starts with a Measure as the field to configure.

The remaining configuration is done through Configuration -> Report Properties -> Formatting.

Max Value provides you with the option to have a fixed maximum value for the gauge.

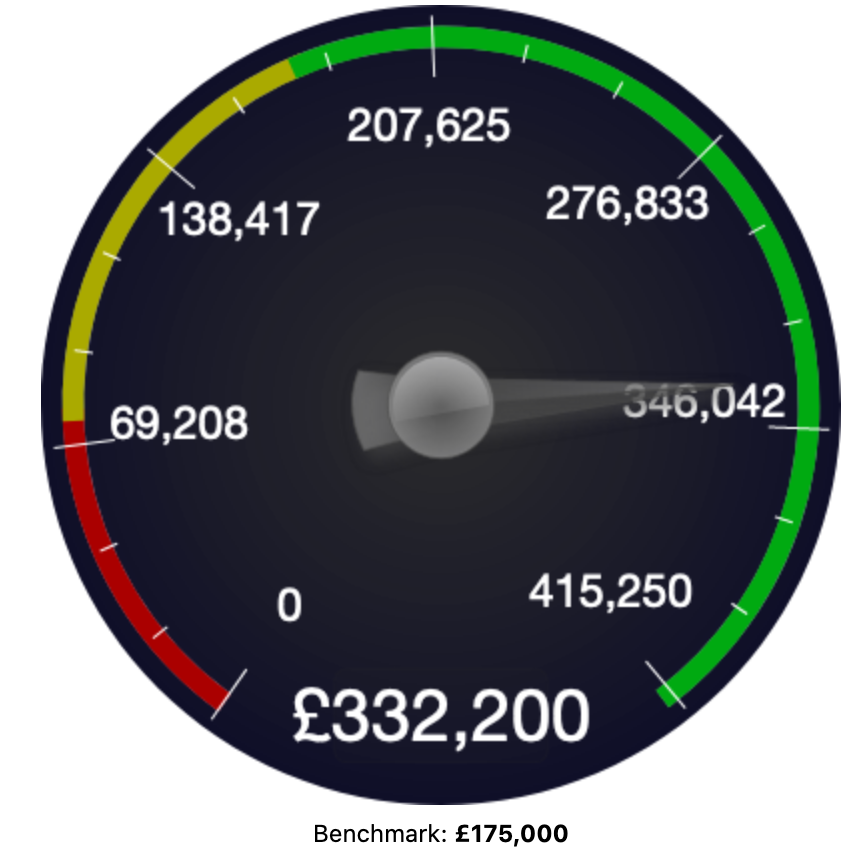
Benchmark Measure allows you to select a second Measure to act as a goal or benchmark value, displayed below the gauge. Benchmark Label allows you to customize the label for that goal or benchmark:

Bar Chart Sample

Color 1, 2, and 3 and Alert Points 1 and 2 define the colors used in different gauge segments.

You can also choose to pull Max Value, Alert Measure 1, and Alert Measure 2 from fields in your data as opposed to using fixed numbers.

RESOURCES
Twitter Logo