Easy Insight Logo
Call 1-(720)-316-8174

Crosstab Reports

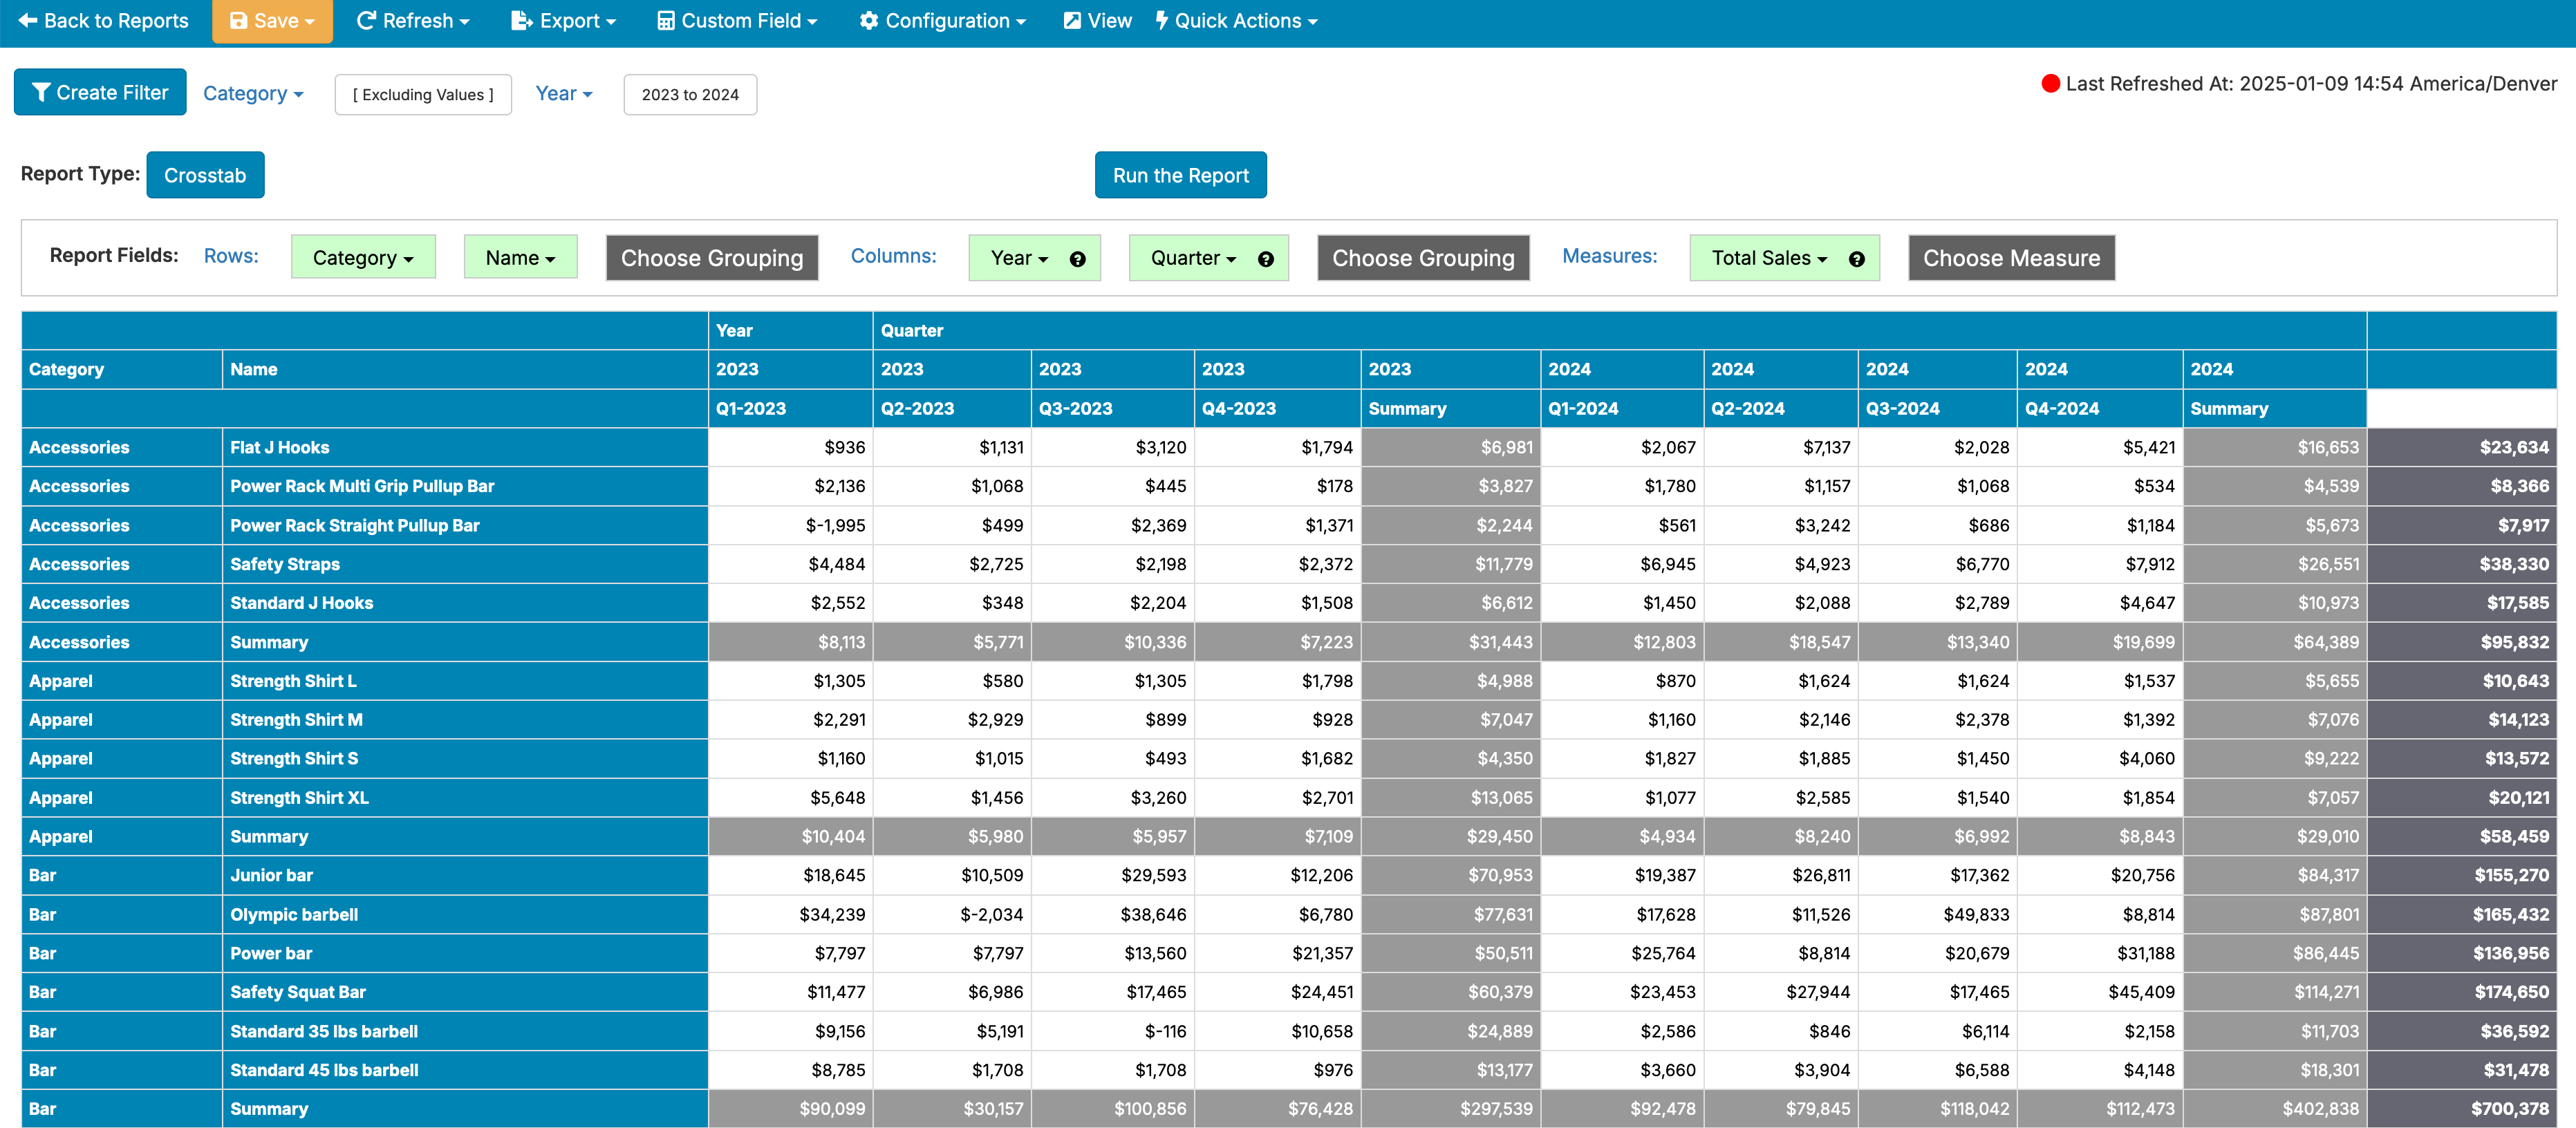
Crosstab reports allow you to look at the combination of multiple Groupings and Measures to look for particularly meaningful combinations within your data.

List Report Sample

In this example, you can see how much new business each sales representative has generated for each month of the year.

Within the report editor, you can drag groupings into the Row drop area and they'll appear along the vertical side of the report. Drag groupings into the Column drop area and they'll appear across the report horizontally. Finally, add measures to the the Measure drop area to choose just what numeric value you're evaluating in the crosstab.

Formatting Properties

The following properties are set in the Report Editor -> Configuration -> Report Properties -> Formatting.

  • Font Size: Specifies the font size used in rendering the crosstab.
  • Sort by Row Summaries: If toggled, rows in the crosstab will be sorted based on their summary total.
  • Zeroes to Empty: If toggled, any measure with a value of zero will be shown instead as a blank cell.
  • No Row Summaries: If toggled, no summary column will shown for each row as the rightmost column of the crosstab.
  • No Column Summaries: If toggled, no summary row will shown for each column as the bottom row of the crosstab.
  • Row Summary Label: If a value is present here, it will be shown above the row summary column.
  • Column Summary Label: If a value is present here, it will be shown before the column summary row.
  • Minimum Column Width: If a value is set here (in pixels), each column will have that value as its minimum width. If you have a large number of values in your Column field, this setting can be useful for ensuring that columns are wide enough to be clear to the user.
  • Default Measure Alignment: If specified, all measures on the report will be aligned to the specified direction of Left, Center, or Right.
  • Font Family: If specified, the custom font configured will be used for rendering the list.
Color Scheme Properties

The following properties are set in the Report Editor -> Configuration -> Report Properties -> Color Scheme.

  • Color Set: This property determines which color scheme is used in the report. When set to Primary or Secondary, it will use the colors defined in your Account Skin in the Account section of the application. If you set the property to None, you can customize the color scheme for the report.
RESOURCES
Twitter Logo