Easy Insight Logo
Call 1-(720)-316-8174

Tree Reports

A Tree is a hierarchical view of tabular data. Unlike Summary reports, a tree enables you to expand and collapse levels of the hierarchy.

Tree Sample

In the above example, the tree is displaying a hierarchy of Deal Status -> Current Stage.

You can expand and collapse folders to hone in on certain data within the hierarchy.

Dynamic Column Trees

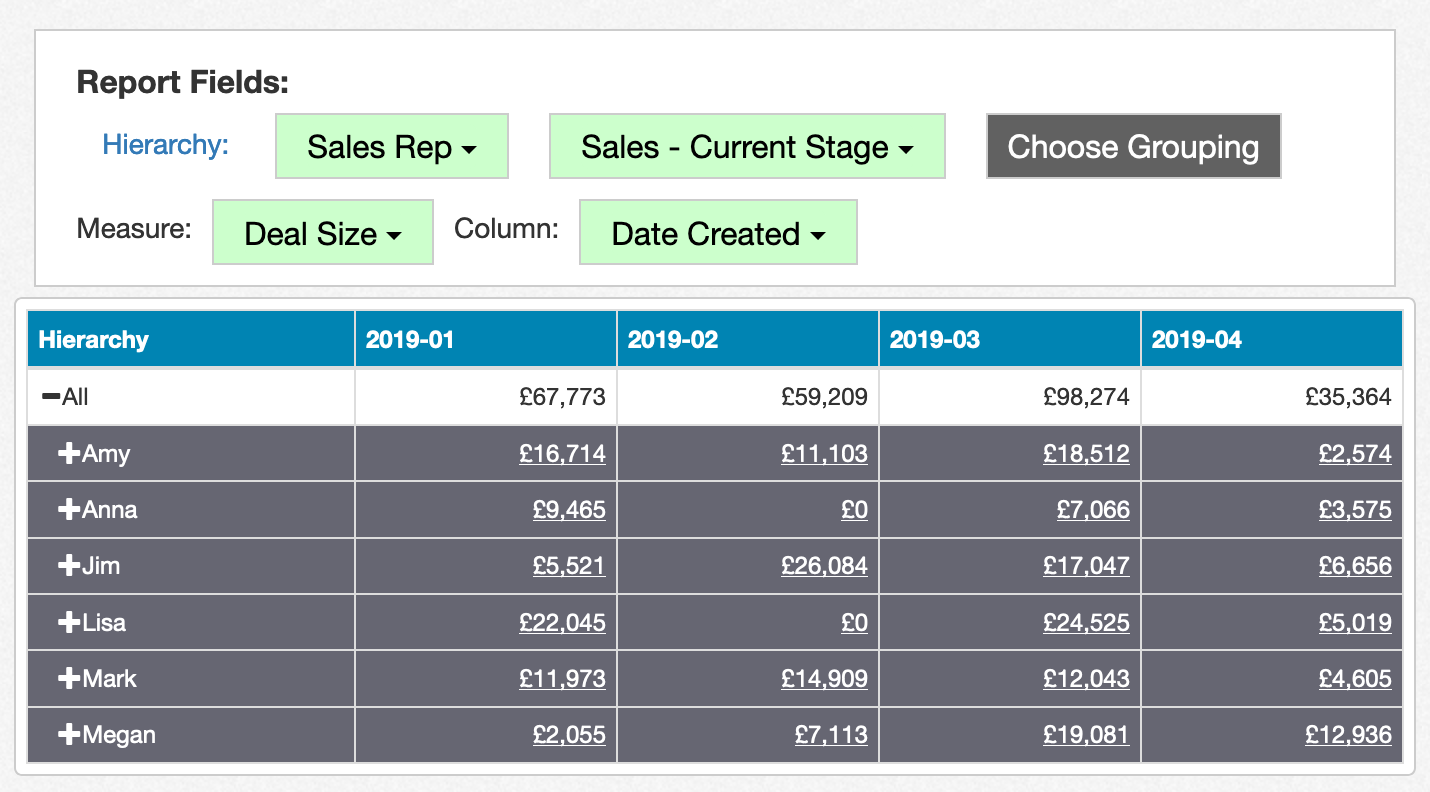
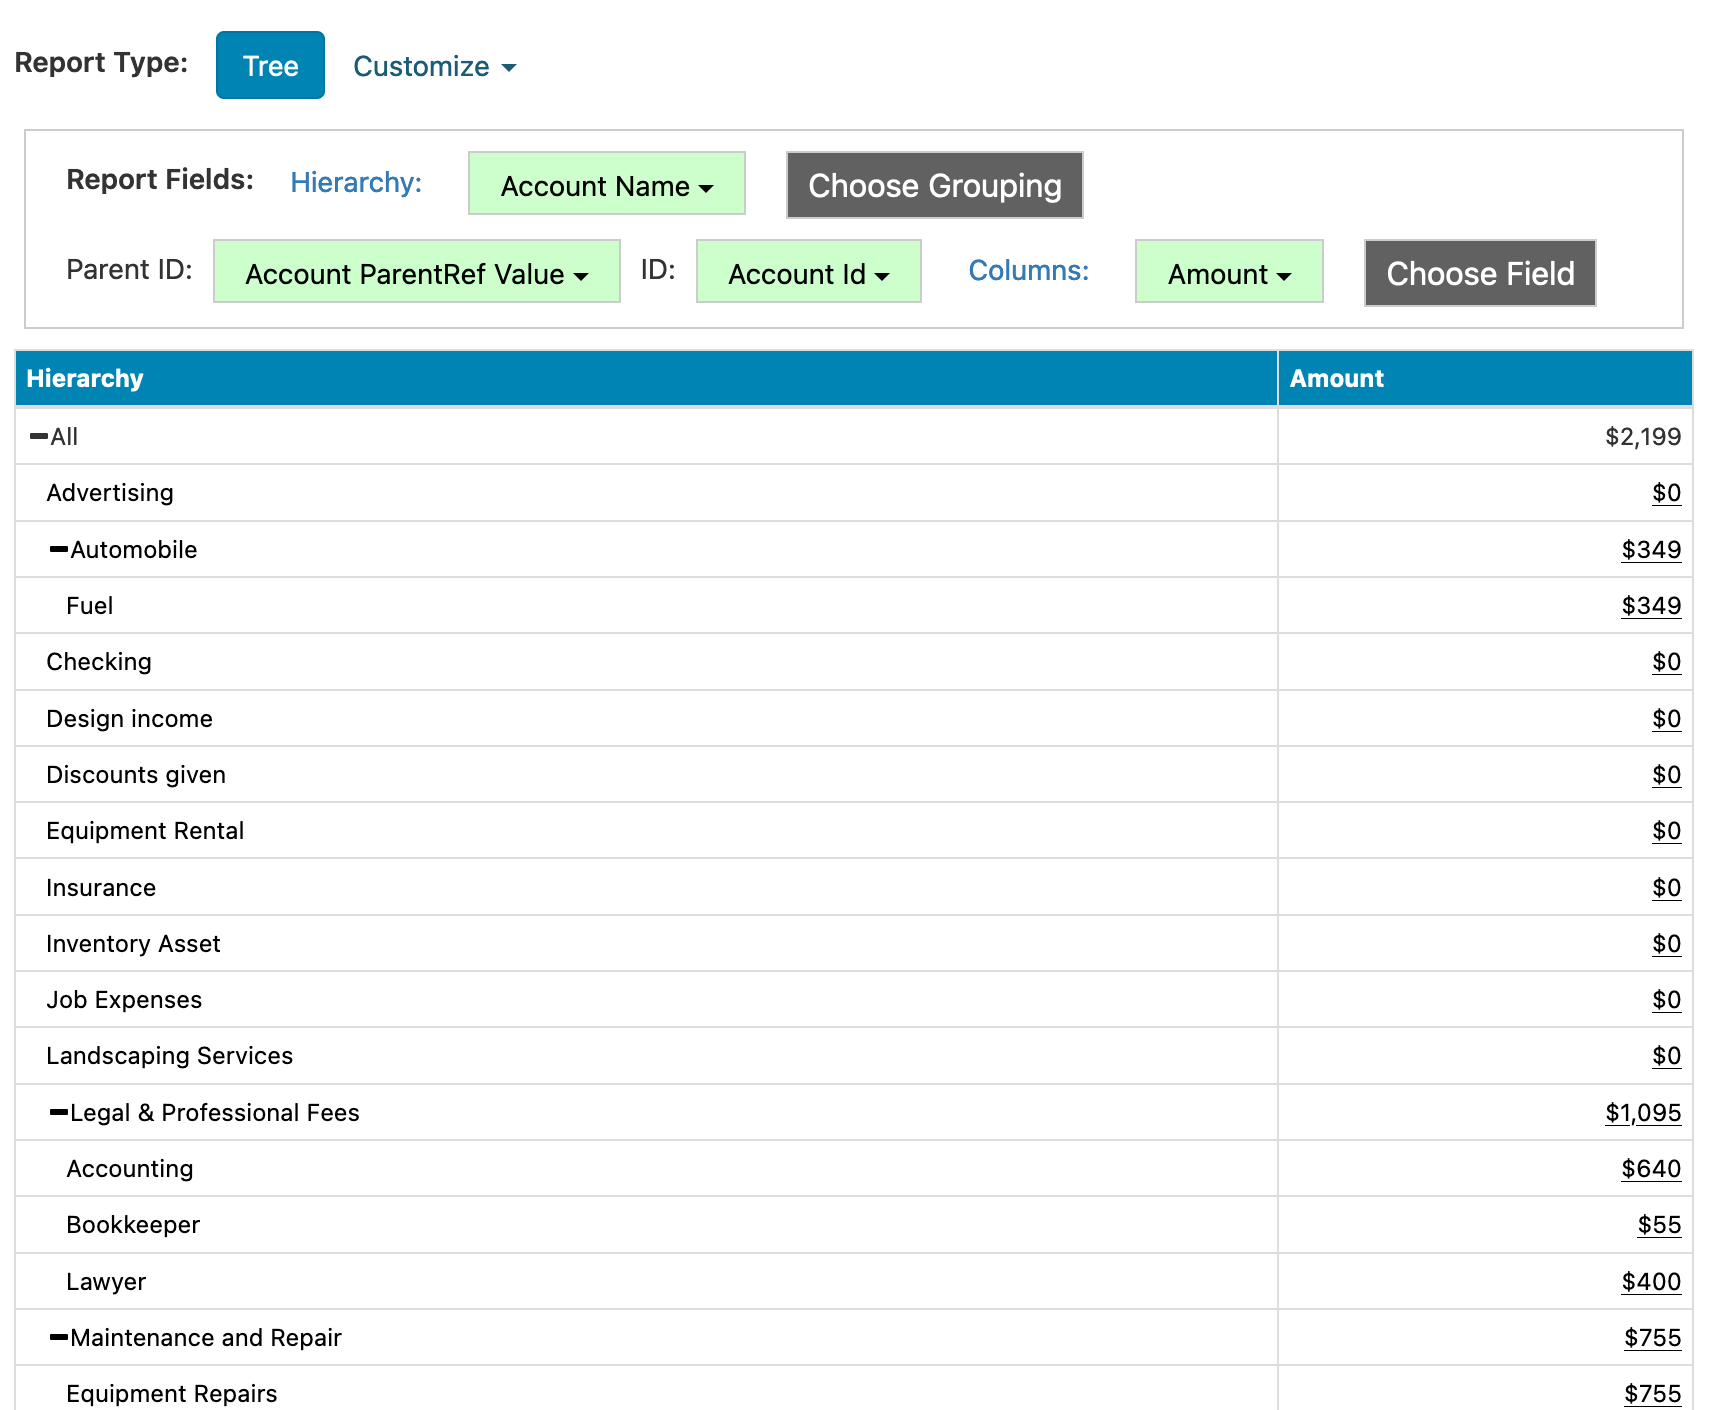
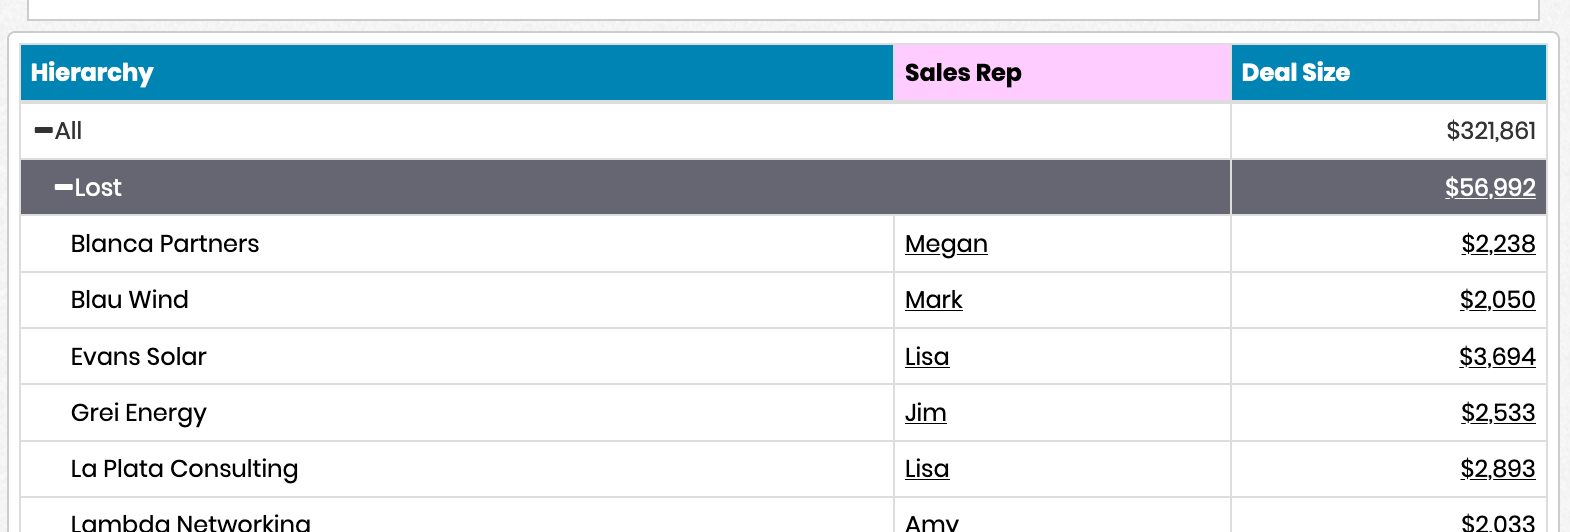
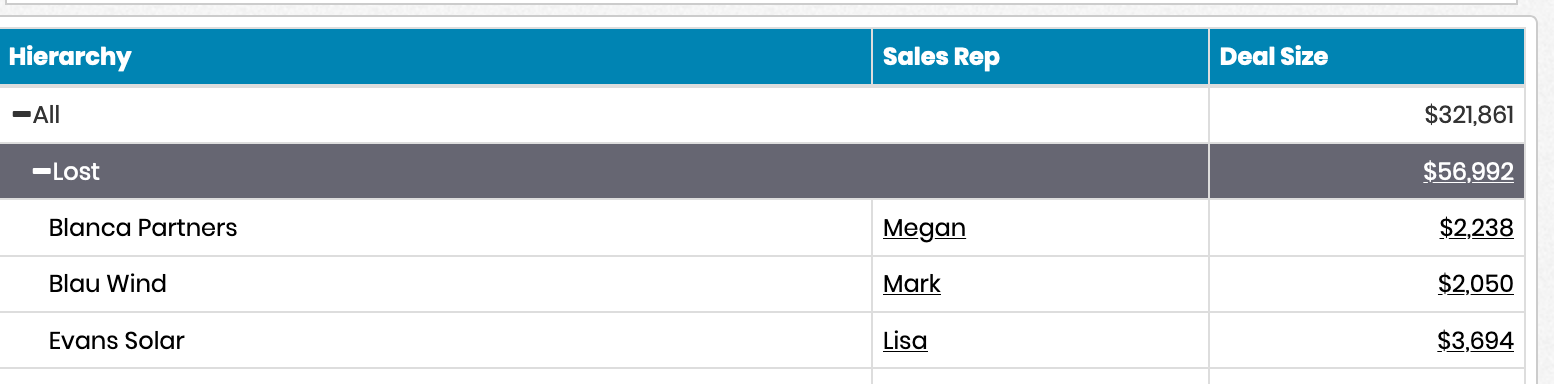
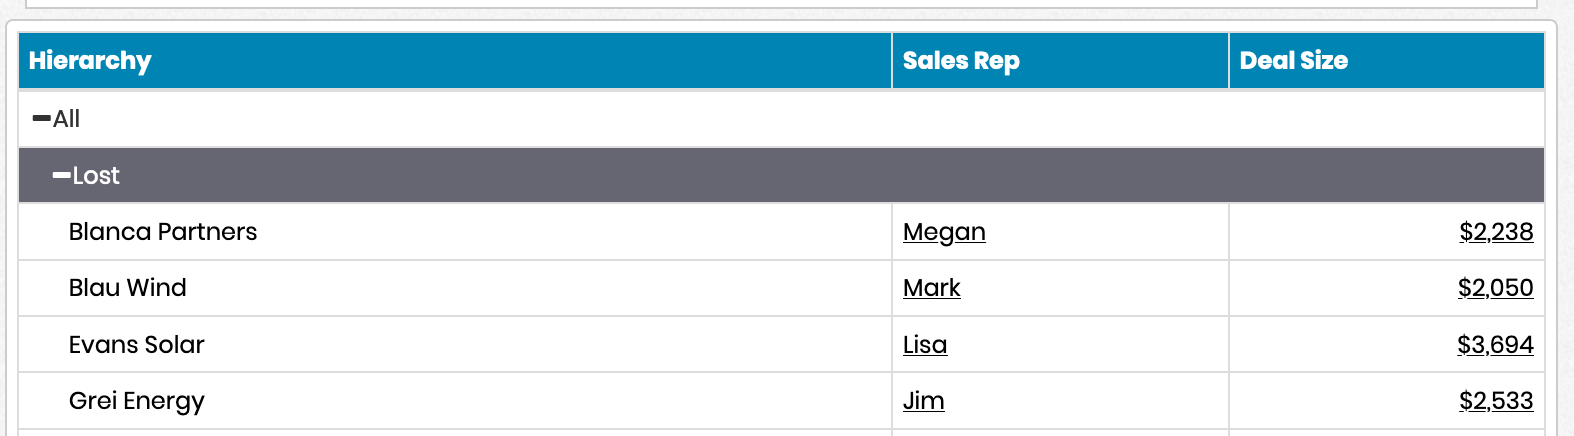
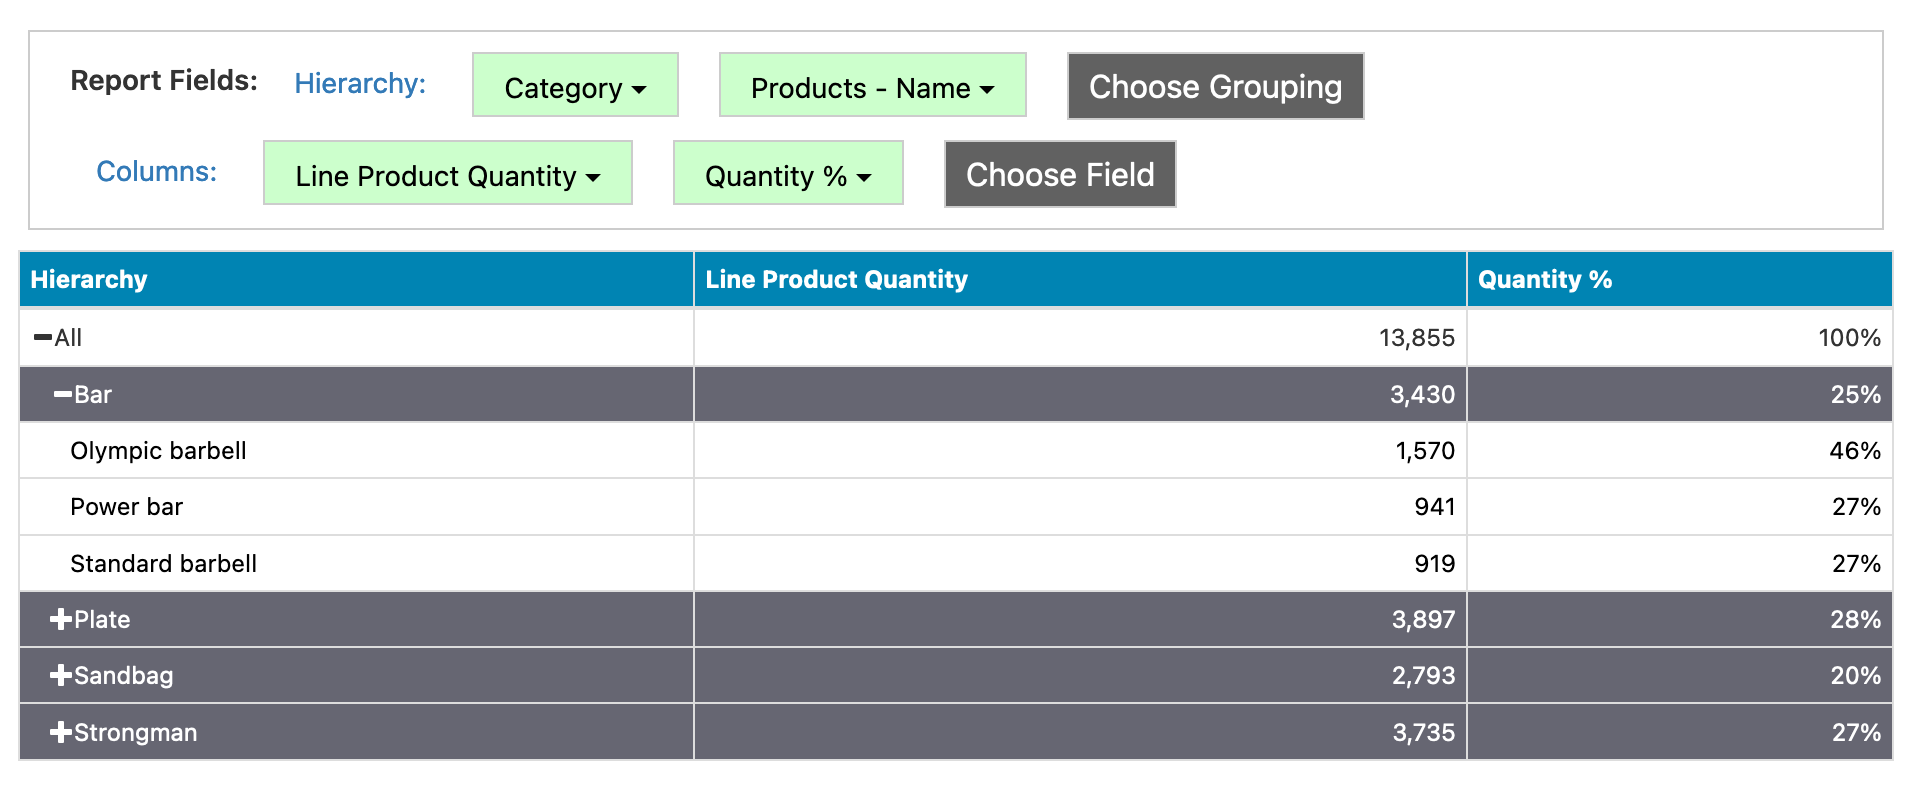
Normally, you'll select some combination of fields to represent the columns of the tree table. Alternatively, you can select a grouping and a measure, and the table will automatically add a column showing the measure broken out by each value found in the grouping. If a filter is present in the report on that grouping, it will use that filter to restrict what's shown. To accomplish this, after you've selected Tree as the report type, click on the Customize link next to the Report Type button and choose 'Dynamic Column Tree'. Define your hierarchy, then choose a grouping and a measure to populate the rest of the report as shown below:

Dynamic Tree Image

Cascading Trees

You can also create a cascading tree if your data has a set of parent/child relationships. For example, you might want to look at:For example, project management tools often have parent task -> subtask relationships. You can use cascading trees to display subtasks nested underneath their parent tasks.

  • Tasks and their nested subtasks, since a subtask might have its own subtasks
  • Line items in a bill of materials, since you might have subassemblies under a particular line item
  • Accounts in an accounting report, since you might have multiple levels of nested accounts

To get started, choose a report type of Tree. Click on the "Customize" link and choose Cascading Tree as the subtype. You'll build your tree as normal, but you'll need to specify the parent ID and row ID fields used in matching up parent/child values. Here are some specific examples of how you'd configure this:

For Teamwork tasks, you might have Project Name, Task List Name, and Task Name as the hierarchy, with Task Parent ID as the Parent ID and Task ID as the ID:

Teamwork Task Example

For Katana recipes, you might have Sku as the hierarchy, Recipe Product Variant Id as the Parent ID, and Variants - Id as the ID:

Katana BOM Example

For QuickBooks Online, you might have Account Name as the hierarchy, Account ParentRef Value as the parent ID, and Account Id as the ID:

QBO Accounts Example

There are three configuration settings specific to cascading trees that you can use to define specific behavior:

No Tree Aggregation -- if enabled, the tree won't aggregate data across different levels. For example, if you're looking at quantity on a BOM/recipe line, it doesn't make sense for that number to roll up across the report. By enabling this setting, values won't aggregate back up to parents.

Filter for Tree -- if you add the name of a filter to this setting, the tree will pull all parent rows leading up to the filtered values. For example, if you search on an ingredient SKU of Widget1, all products which use Widget1 in their BOM will show up in the tree. This setting works particularly well if you're using the report as a drillthrough target, for example if you're setting it up for the user to click on a SKU and jump into the recipe of components and subassemblies making up the BOM for that SKU.

Pull All Related -- if enabled, all child data tied to the value matching the filter in the Filter for Tree setting will be included as well. Using the earlier example of Widget1, if Widget1 itself is built using SubWidget1 and SubWidget2, SubWidget1 and SubWidget2 will show up in the report as well.

Custom Column Header Color

You can change the header color of a specific column, click on the field in the report, choose Edit Field, and go to the Text tab. At the bottom of the tab, you'll see options for Header Background Color and Header Text Color. Using these options, you can set up reports like the following:

Tree Coloring
Displaying Fields at Different Tree Levels

By default, measure values are rolled up across all levels of the tree and groupings are only shown at the bottom level of the tree, as shown:

Default Rollup Behavior

To hide a measure and only show it at the bottom level of the tree, click on the measure field in the report, choose Edit Field, and go to the Text tab. Toggle 'Ignore on Summary' to only show the measure value on the bottom level of the tree:

Hiding Measure on Tree

To display a grouping at higher levels of the tree, click on the grouping field in the report, choose Edit Field, and go to the Text tab. Toggle 'Force to Summary' to show the grouping at higher levels. You can choose to specify a Summary Level as well, starting at 0 for the top most level of the hierarchy. For example, putting in 1 for this value will start displaying the grouping at the 2nd level of the hierarchy:

Tree Grouping
Percentage of Totals

You can choose to recalculate percentages of total per tree level. For example, if your report has a hierarchy of Category -> Product Name, you could show the percentage of total by category across the report, then show the percentage of total of products within the category. First, toggle the 'Percent of Total per Level' setting under Configuration -> Report Properties -> Formatting:

Percentage of Total Report Configuration

Edit your field in the tree and choose Percent of Total as the aggregation:

Percentage of Total Field Configuration

The resulting report shows the percentage of total per tree level:

Percentage of Total Result

You can choose to recalculate percentages of total per tree level. For example, if your report has a hierarchy of Category -> Product Name, you could show the percentage of total by category across the report, then show the percentage of total of products within the category. First, toggle the 'Percent of Total per Level' setting under Configuration -> Report Properties -> Formatting:

Color Scheme Properties

The following properties are set in the Report Editor -> Additional Configuration -> Edit Properties -> Color Scheme.

  • Color Set: This property determines which color scheme is used in the report. When set to Primary or Secondary, it will use the colors defined in your Account Skin in the Account section of the application. If you set the property to None, you can customize the color scheme for the report.
RESOURCES
Twitter Logo