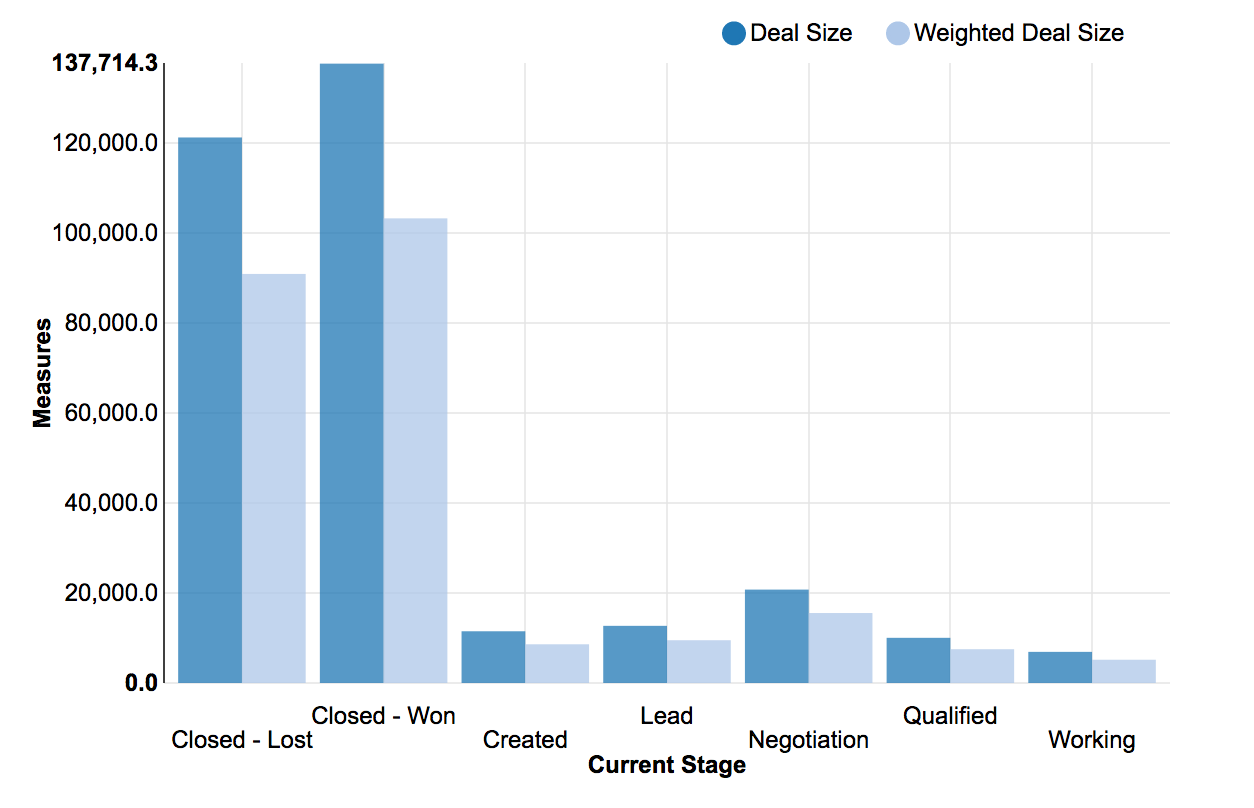
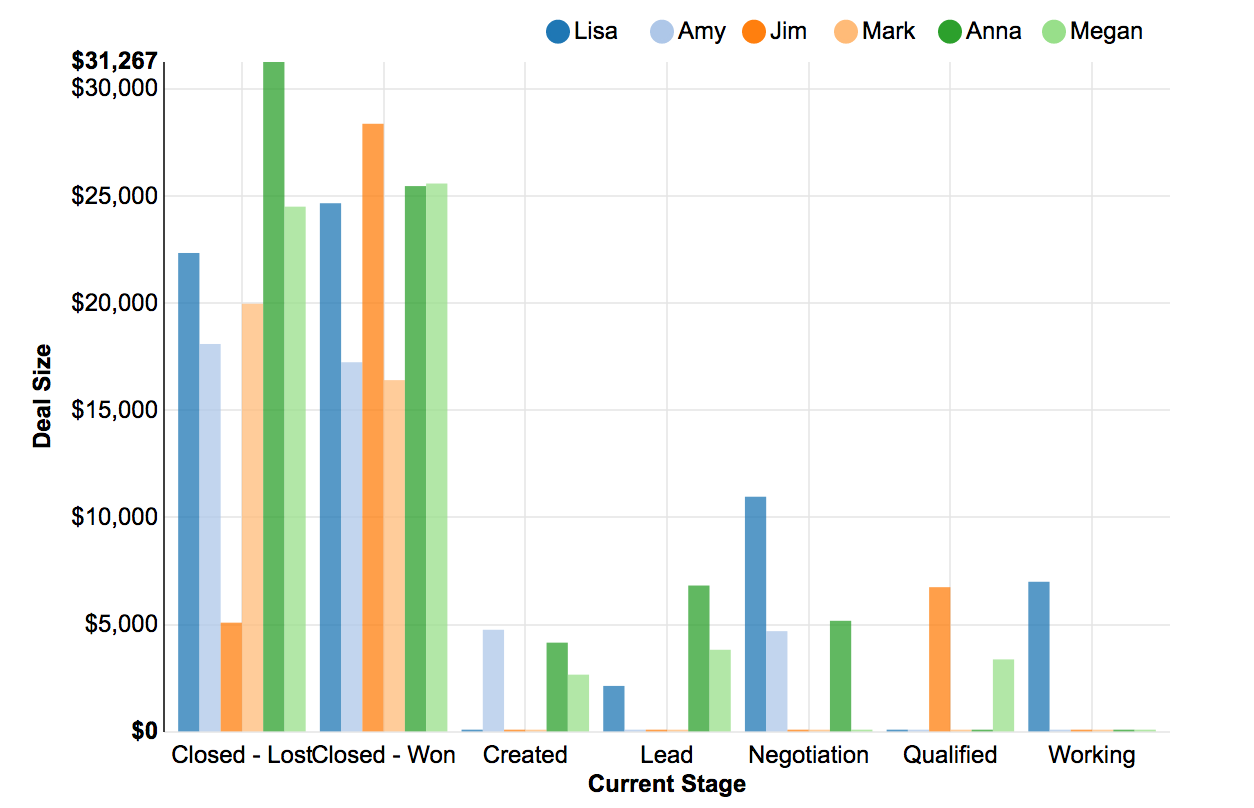
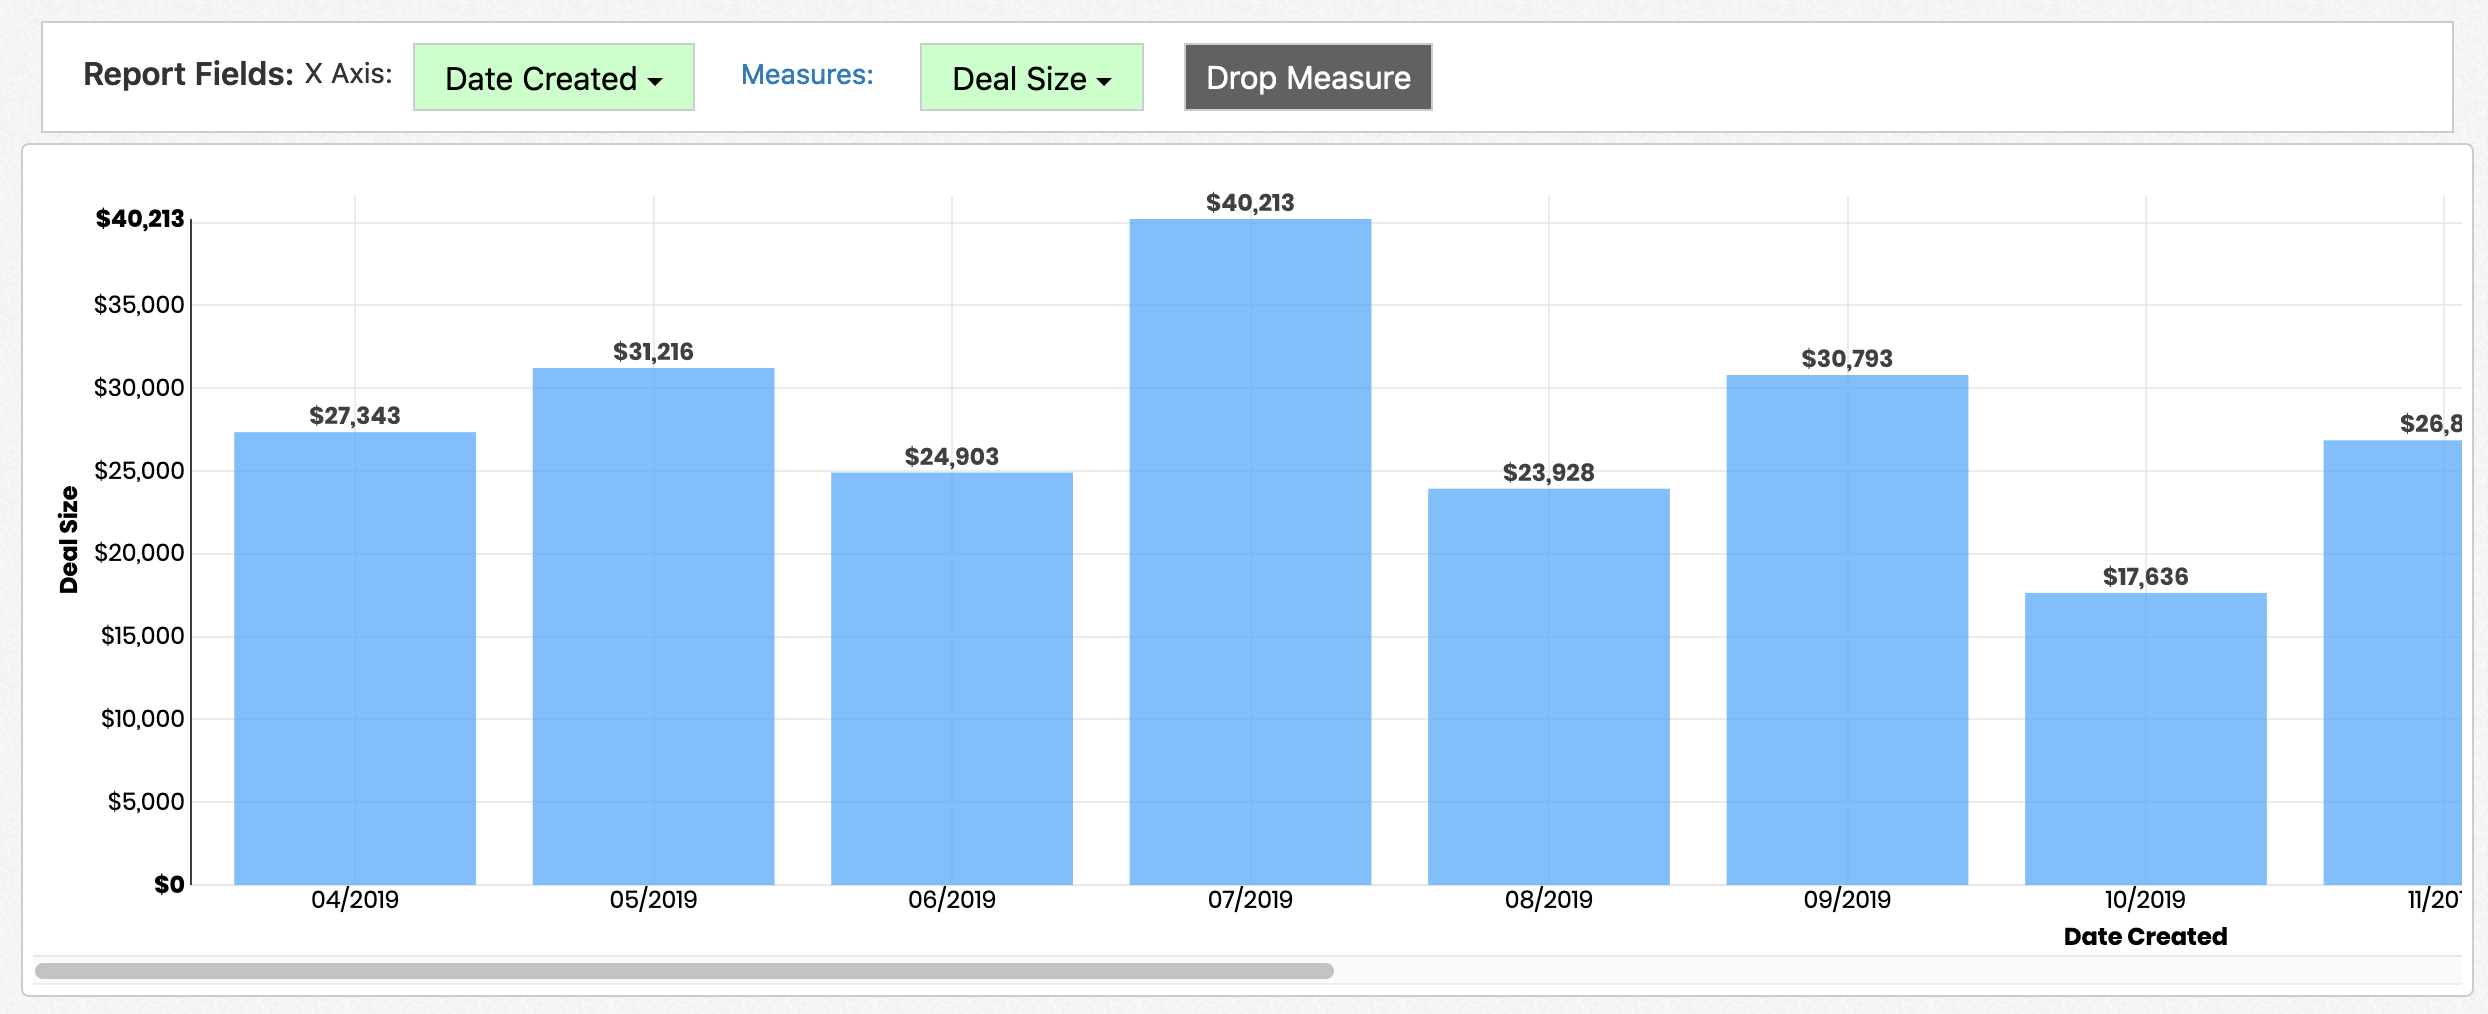
Column charts display combinations of groupings and measures as vertical columns. Three different examples are shown below:
In this example, the column chart is displaying the sum of Deal Size grouped up by each value of Current Stage.
In this example, the column chart is displaying the sums of Deal Size and Weighted Deal Size grouped up by each value of Current Stage.
In this example, the column chart is displaying the sum of Deal Size grouped up by Current Stage, with a separate bar for each Sales Rep.
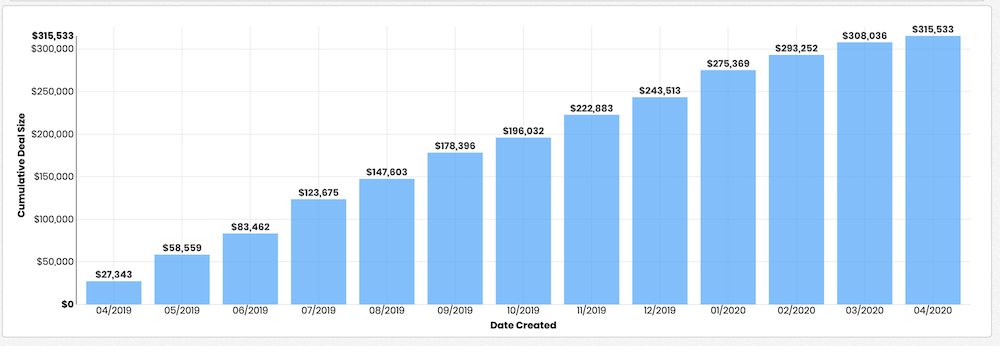
You can toggle the 'Cumulative' setting through the Report Editor -> Configuration -> Report Properties -> Formatting. When toggled, the chart will accumulate values across the different bars in the chart as hown below:
You can set a 'Minimum Column Width' setting through the Report Editor -> Configuration -> Report Properties -> Formatting. This value provides a minimum width (in pixels) for the bars in the chart. If the resulting chart is larger than the available screen width, the chart will enable horizontal scrolling. This setting tends to help with display of large data sets and with display on smaller devices such as phones or tablets.
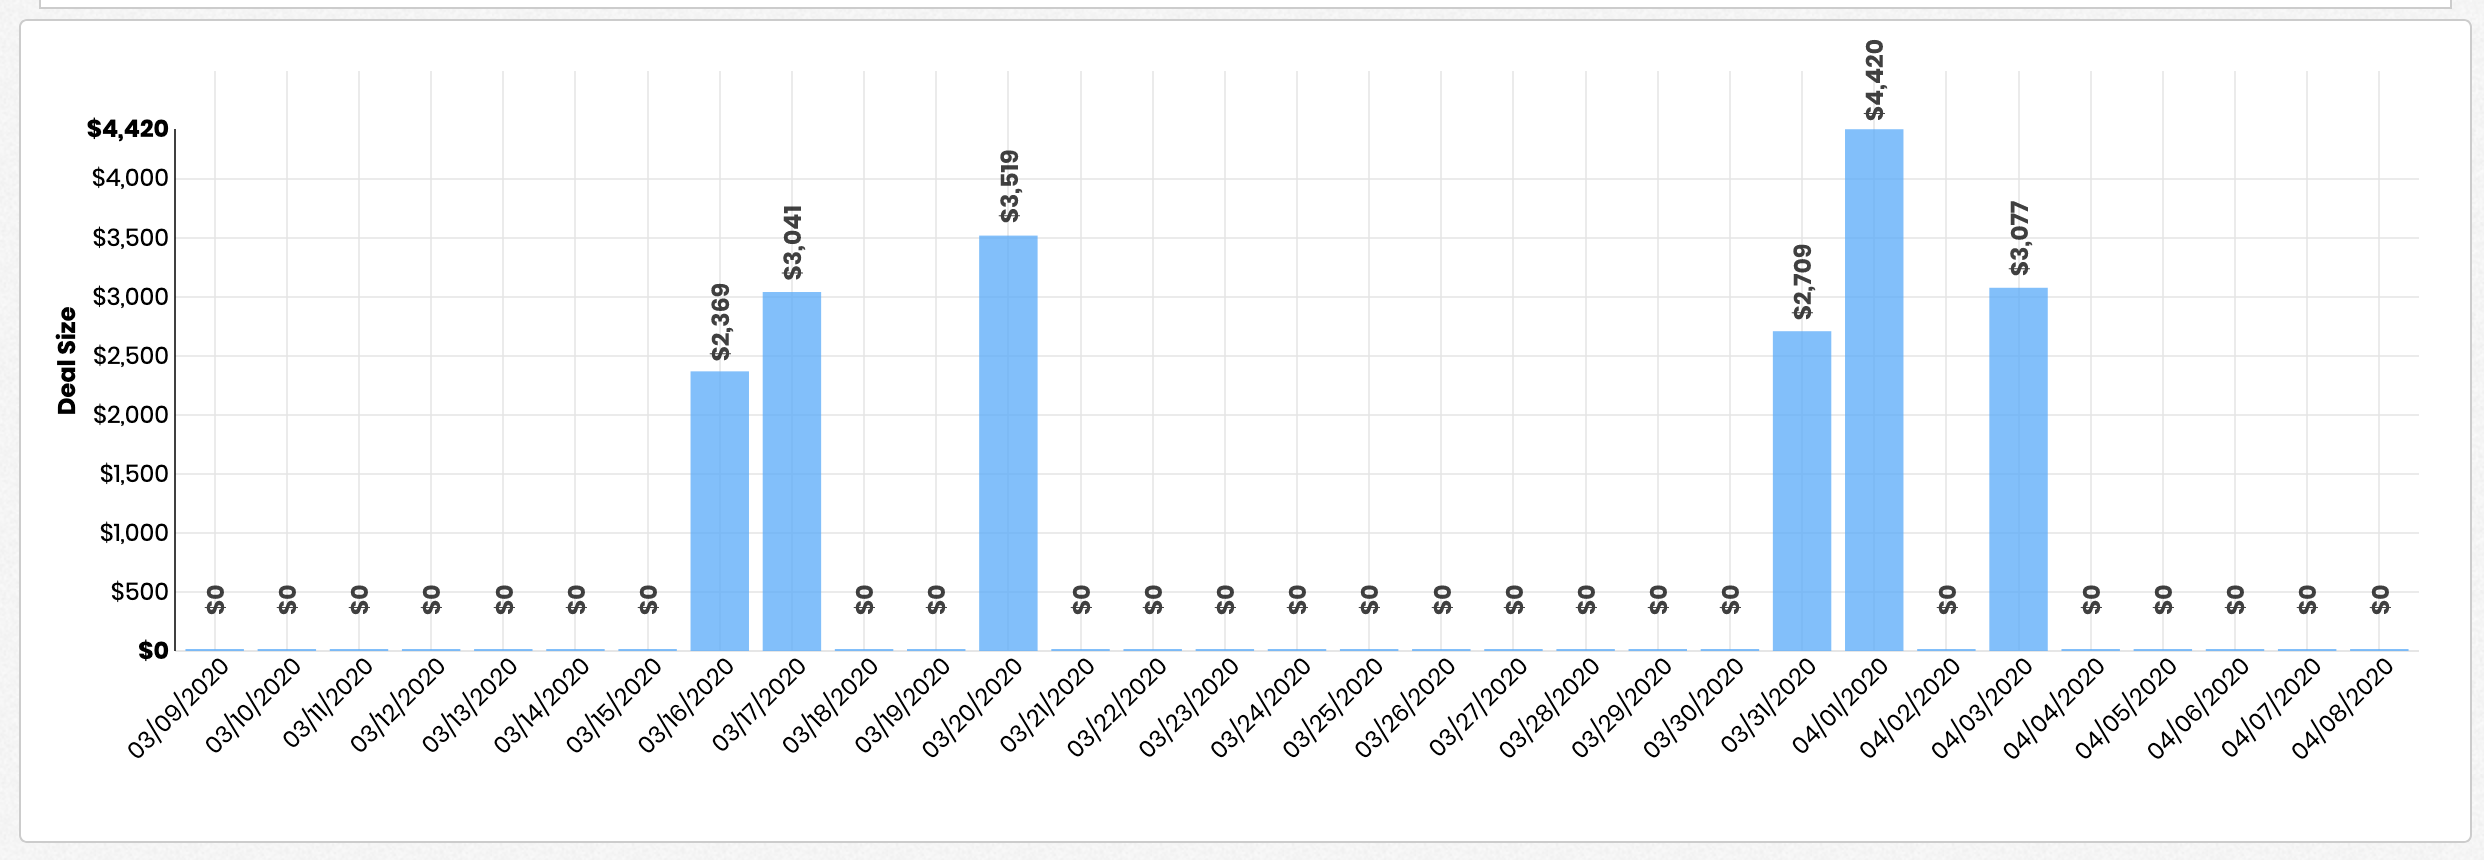
You can toggle the 'Fill In Zero Values' setting through the Report Editor -> Configuration -> Report Properties -> Formatting. When toggled, the chart will include the display of measure values where no data was present as shown below:
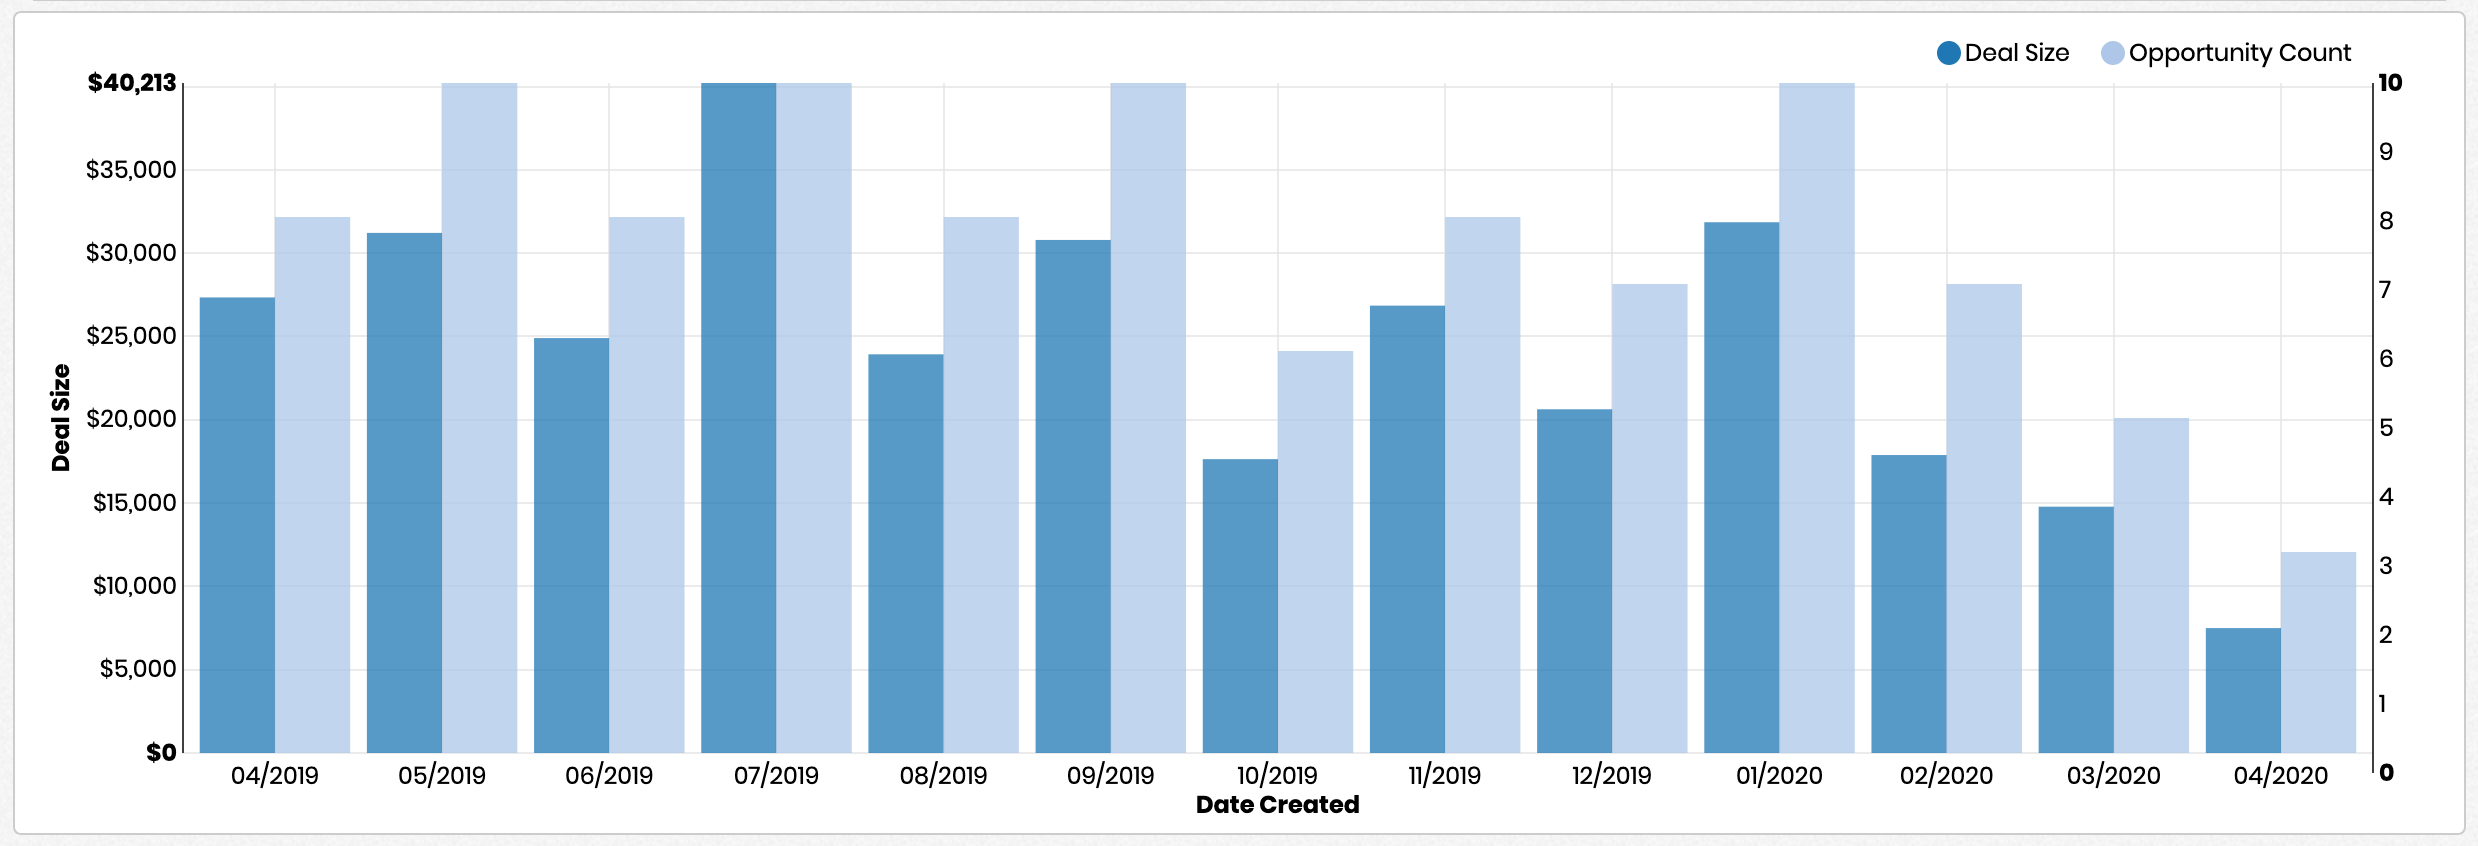
If you have multiple measures in your chart, ou can toggle the 'Two Axis' setting through the Report Editor -> Configuration -> Report Properties -> Formatting. When toggled, the chart will move the second measure of the chart into matching up against an axis drawn on the right side of chart:/p>
The following properties are set in the Report Editor -> Configuration -> Report Properties -> Formatting.
The following properties are set in the Report Editor -> Additional Configuration -> Edit Properties -> Color Scheme.