Contribution profit is a business’s sales revenue less its variable costs. The resulting contribution dollars can be used to cover fixed costs (such as rent), and once those are covered, any excess is considered earnings. Contribution margin (presented as a % or in absolute dollars) can be presented as the total amount, amount for each product line, amount per unit, or as a ratio or percentage of net sales.
Your inventory management system might do a fantastic job of accurately calculating COGS for you, but there are other expenses in your business outside of those purchase and manfuacturing costs tracked in the inventory system. For example:
Contribution profit helps you to accurately assess the profit of your business at a granular level. You can identify the true profit you're seeing from different brands, product categories, and products.
Contribution Profit = Gross Profit - Variable Expenses
Units sold is the number of units that were sold during the period being analyzed.
Beginning inventory is the number of units held in inventory at the start of the same period.
As an example, Company A made a gross profit of $250,000 last month. Company A spent:
Using our above formula:
Contribution Profit = $250,000 - ($40,000 + $20,000 + $30,000 + $80,000)
Company A’s contribution profit is $110,000, giving an overall contribution margin of 44%.
Generally, a good contribution margin varies by industry, but in many sectors, a contribution margin of 30% or higher is considered strong. This means that for every dollar of sales, at least 30 cents contributes to covering fixed costs and profit. Ultimately, a good contribution margin allows a business to sustain its operations, invest in growth, and withstand fluctuations in sales.
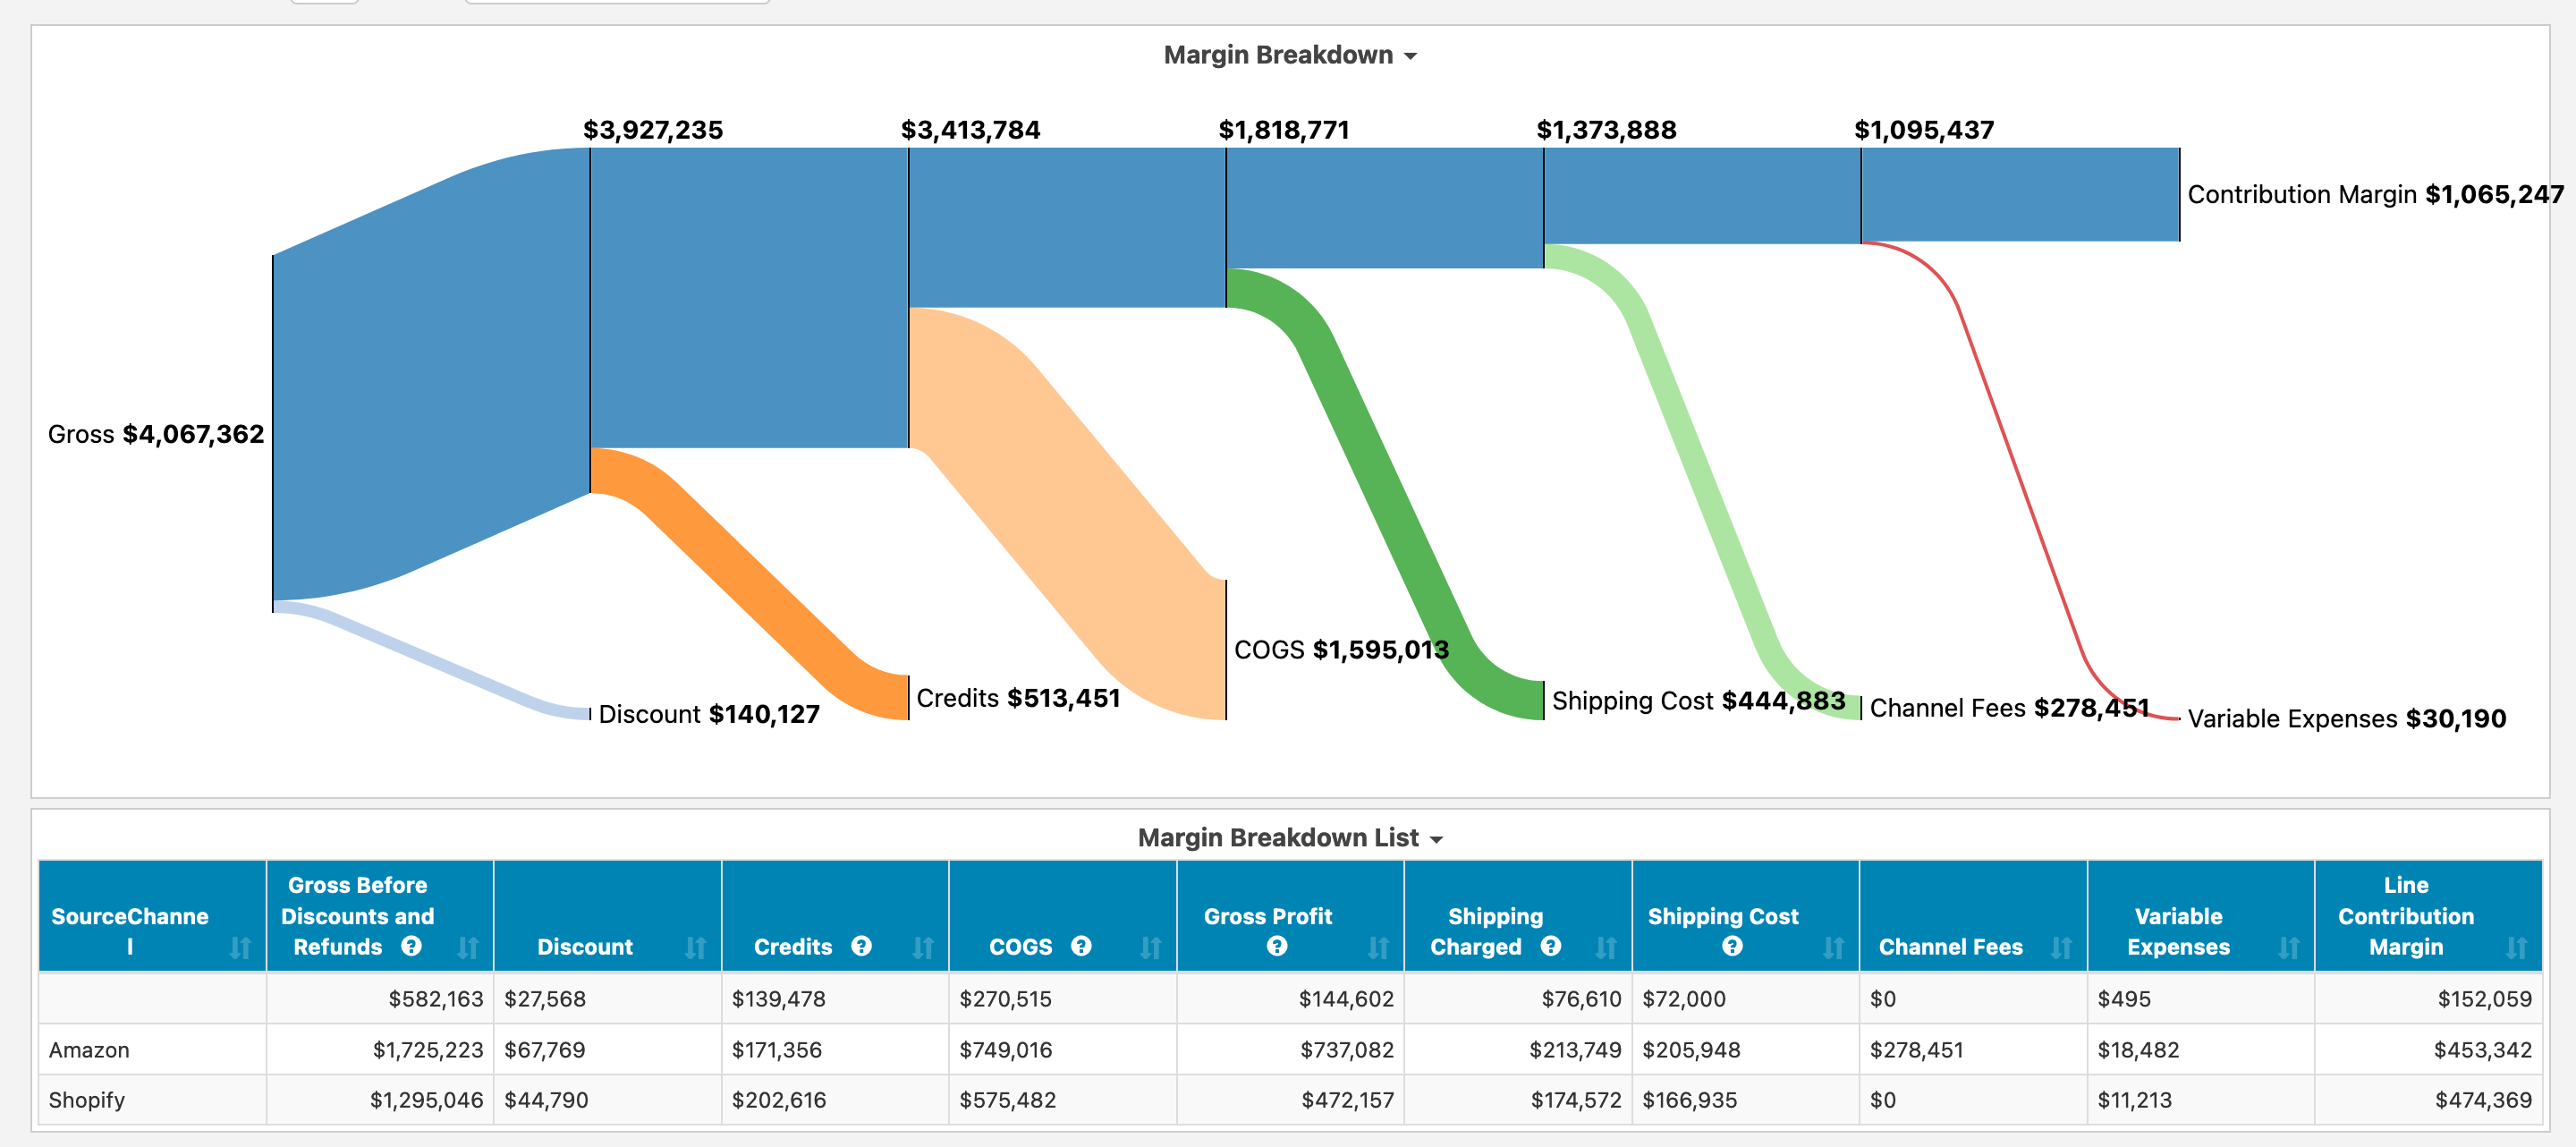
Easy Insight pulls over the COGS from your inventory management system, shipping costs from your shipping platform, channel fees from your e-commerce platforms, and accounting costs from your accounting system to help you calculate contribution profit. In the prebuilt dashboard of your inventory connection, the Margin section includes a variety of views to help you see where exactly your costs are coming from as you work to your end contribution profit:
This view helps you to see discounts, credits, COGS, shipping costs, channel costs, and variable costs all in a single view. You can look at this data across your entire business, break it down by product category or brand, or go all the way to the individual SKU level:
Want to learn about other inventory metrics? See Inventory Metrics for other ways to help measure and improve your business.