All of the inventory management connections in Easy Insight include a 'Customer' section to help you with analyzing your customers. All of these reports use the following definitions:
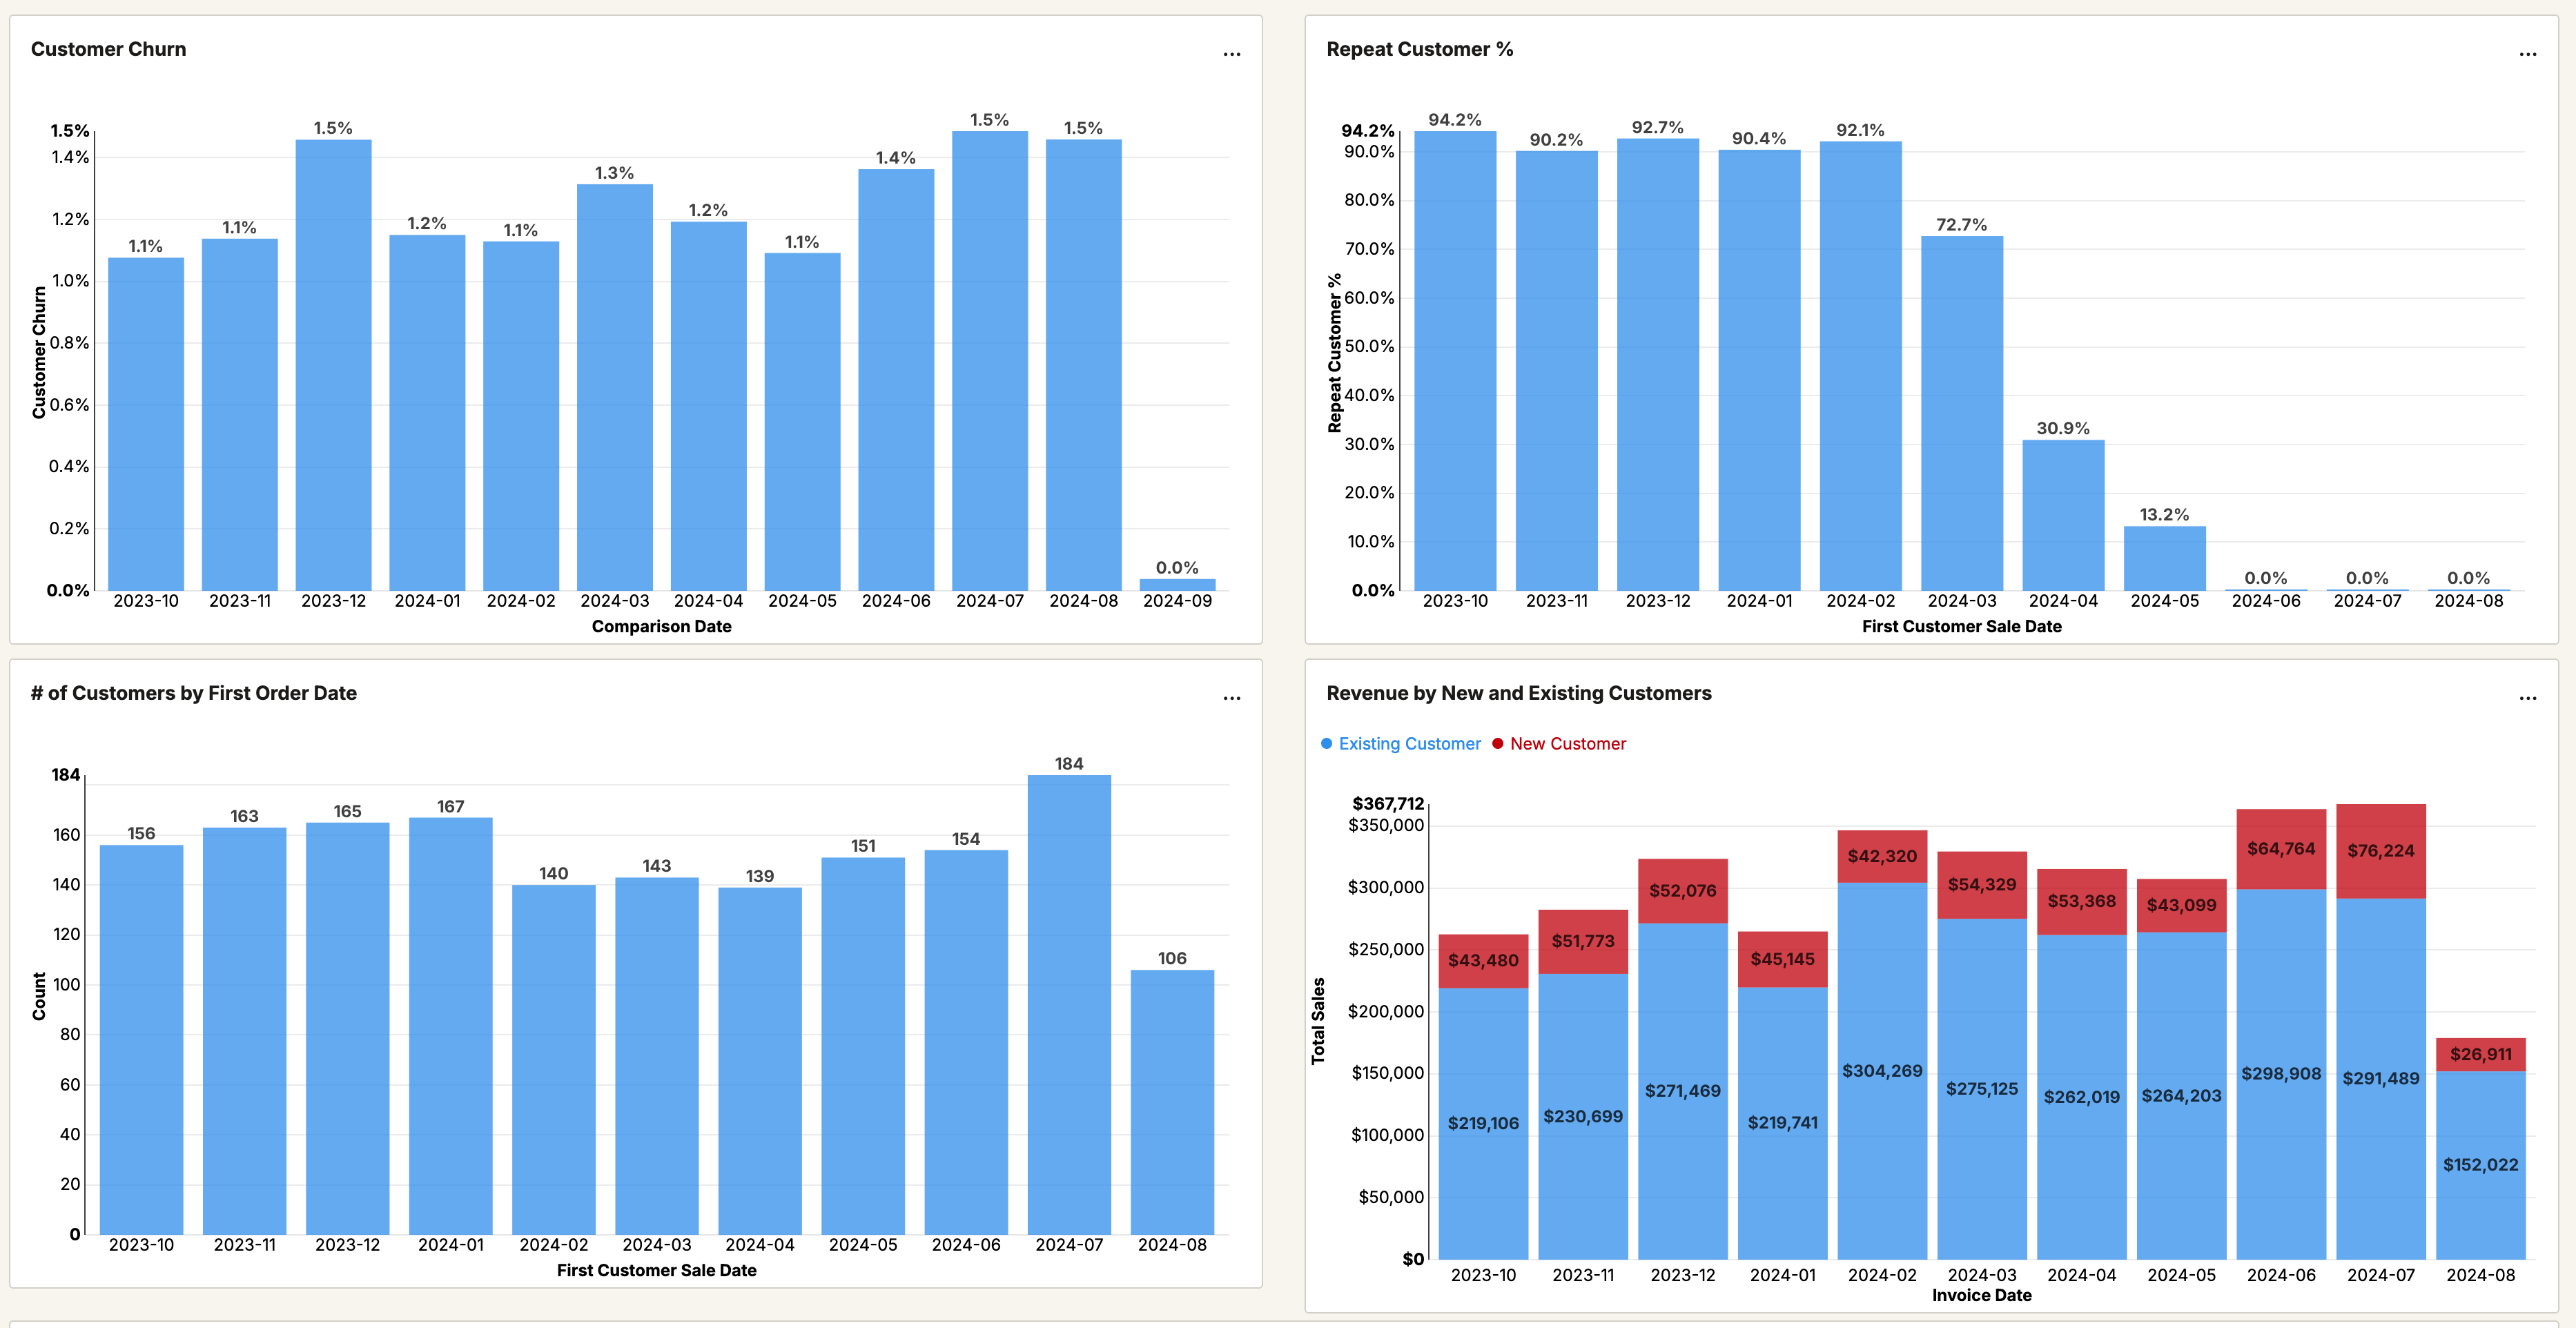
The Customer Overview provides charts showing Customer Churn, Repeat Customer %, # of Customers by First Order Date, and Revenue by New and Existing Customers.
Customer Acquisition by Product shows you which products have been the best at attracting new customers to your business.
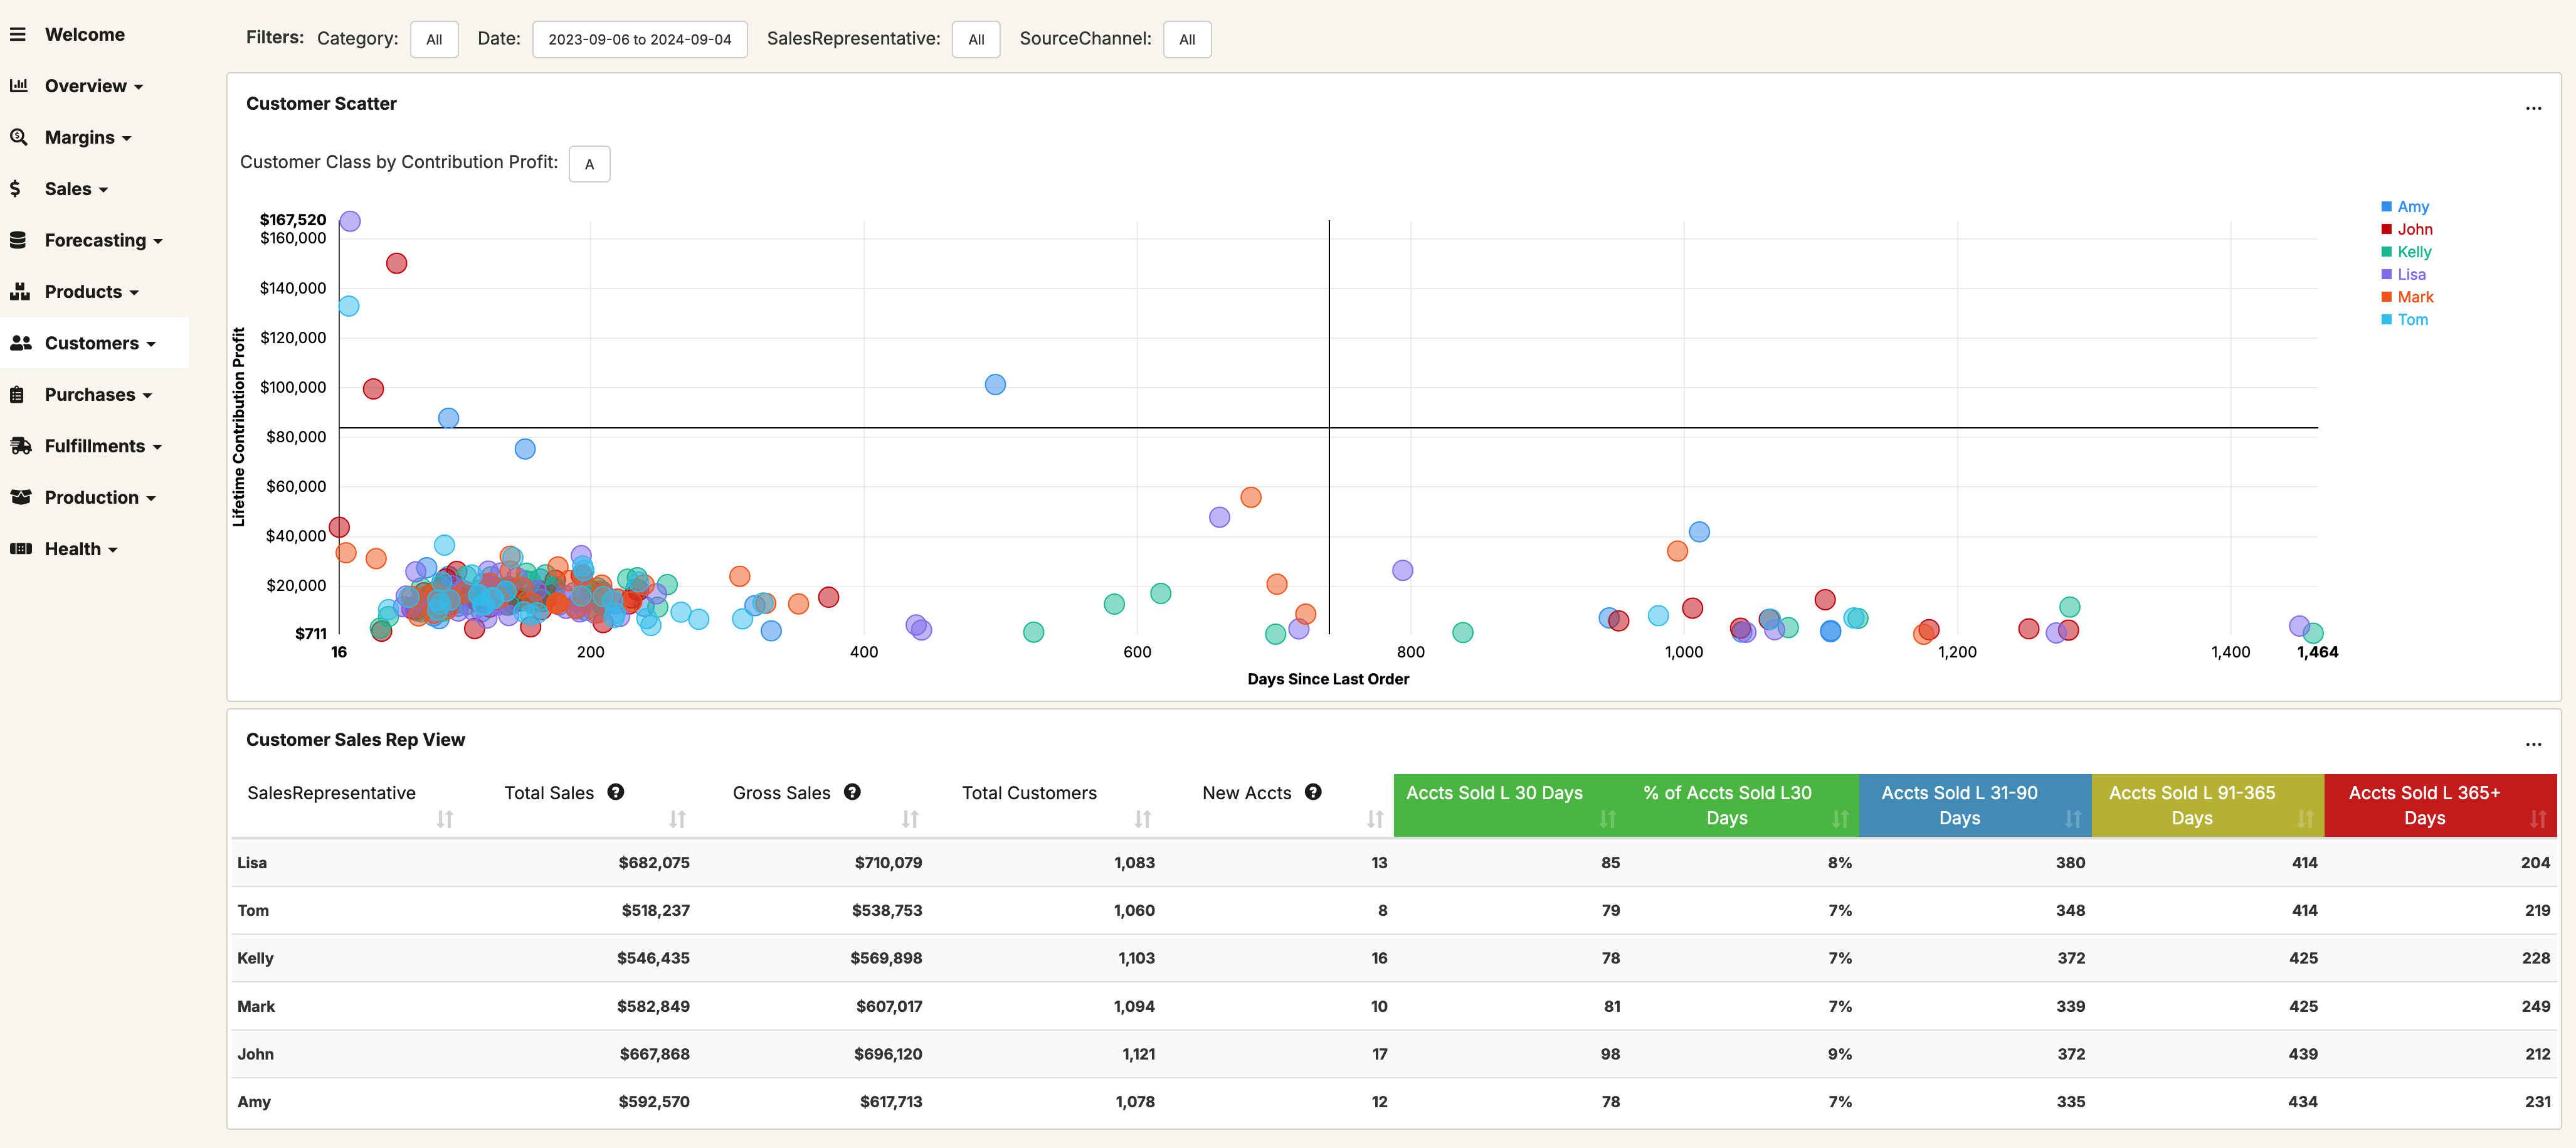
The Customer Sales Rep View gives you a scatter chart of customers by their lifetime contribution profit vs. their last order date. You can use this chart to identify high value customers in danger of dropping off. This chart also includes a breakdown of accounts by rep grouped up by range of their last order date.
Lost Customers enable you to look at customers who haven't made an order in more than 365 days. You can use this to help guide marketing to pull back old customers or investigate why customers dropped off.
Customers With Orders Outside Normal Order Days provides another view into customers in danger of dropping off. This report shows you the average duration between orders for customers and allows you to group up into customers that are outside of that normal range, helping your sales team jump in on high value accounts before they completely drop off.