Easy Insight Logo
Call 1-(720)-316-8174

Dashboard Styling

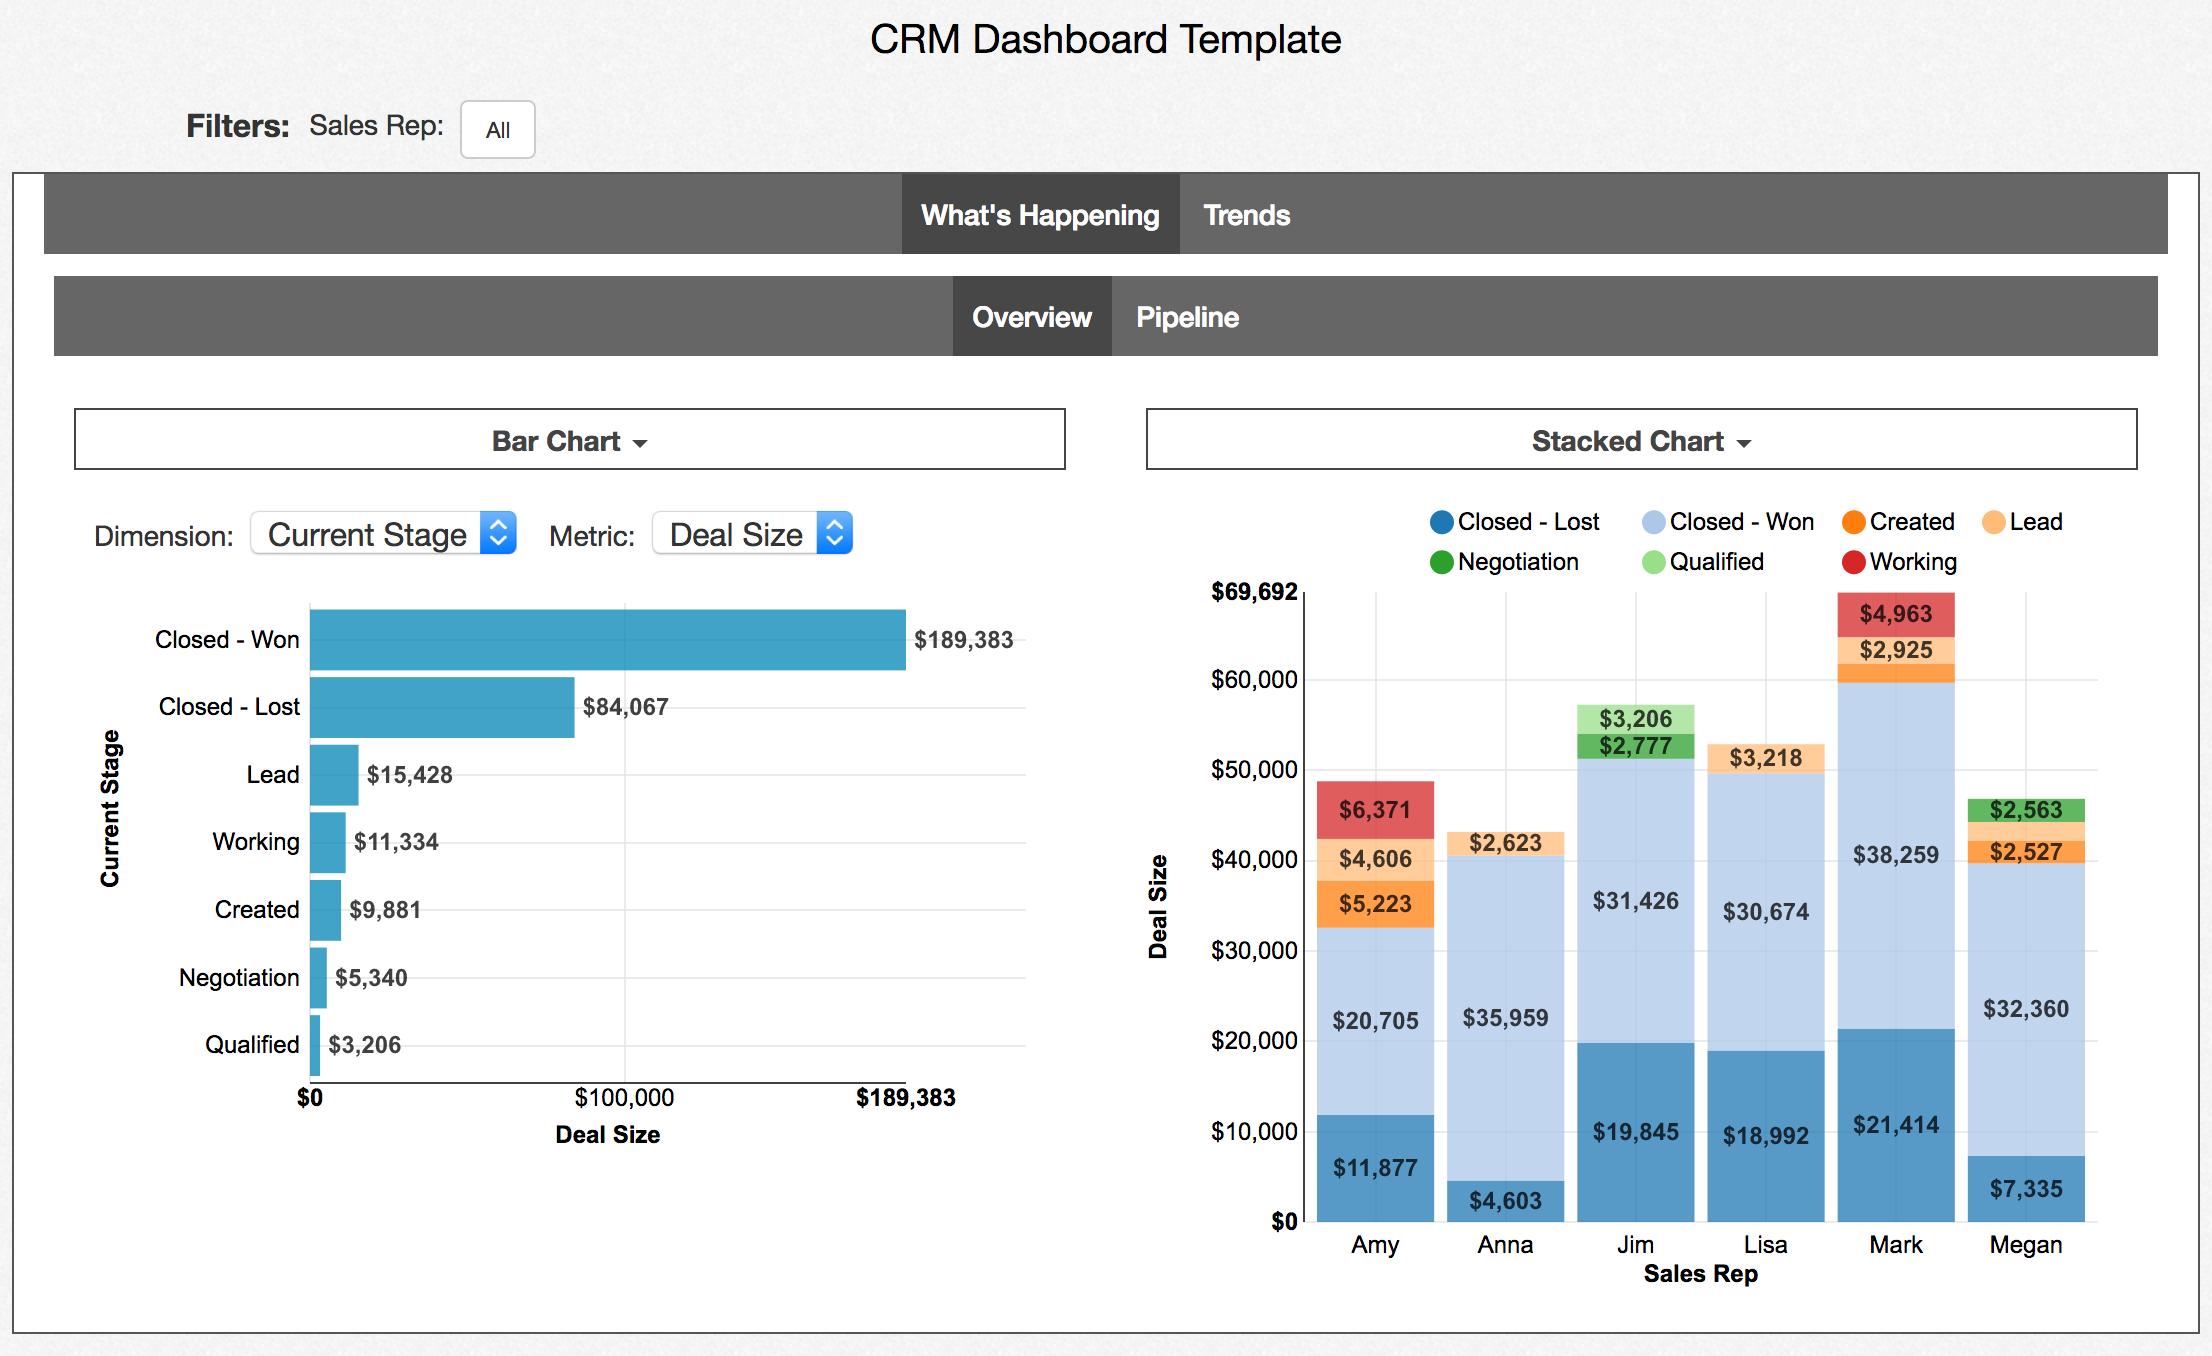
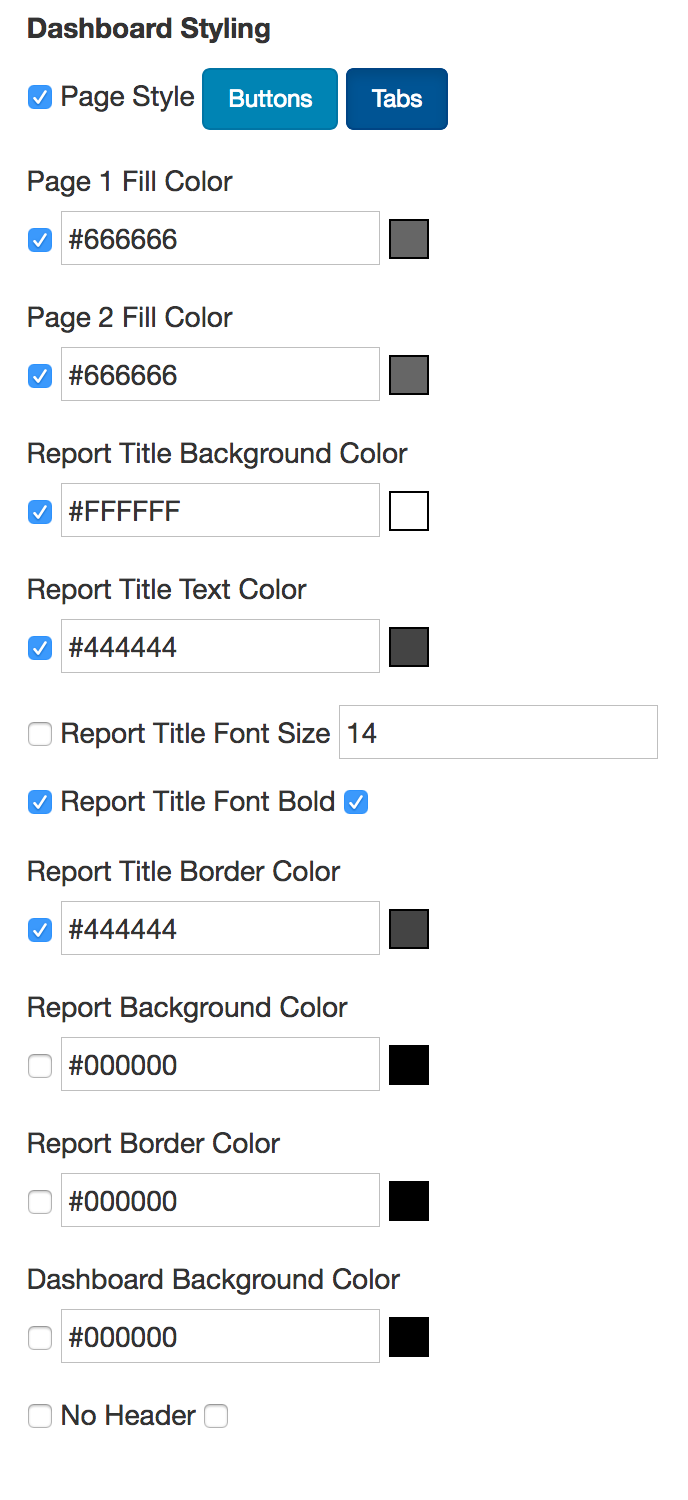
You can style your dashboards through a variety of options. You can customize your account's dashboard styling through the Account Skin page under Account Settings. In the example below, the page headers are set to #666666, a moderate gray. Each report's title is set to a background of #FFFFFF, white, with text of #444444, the text is bolded, and a border is shown around the title in the same #444444.

Distribute Dashboard

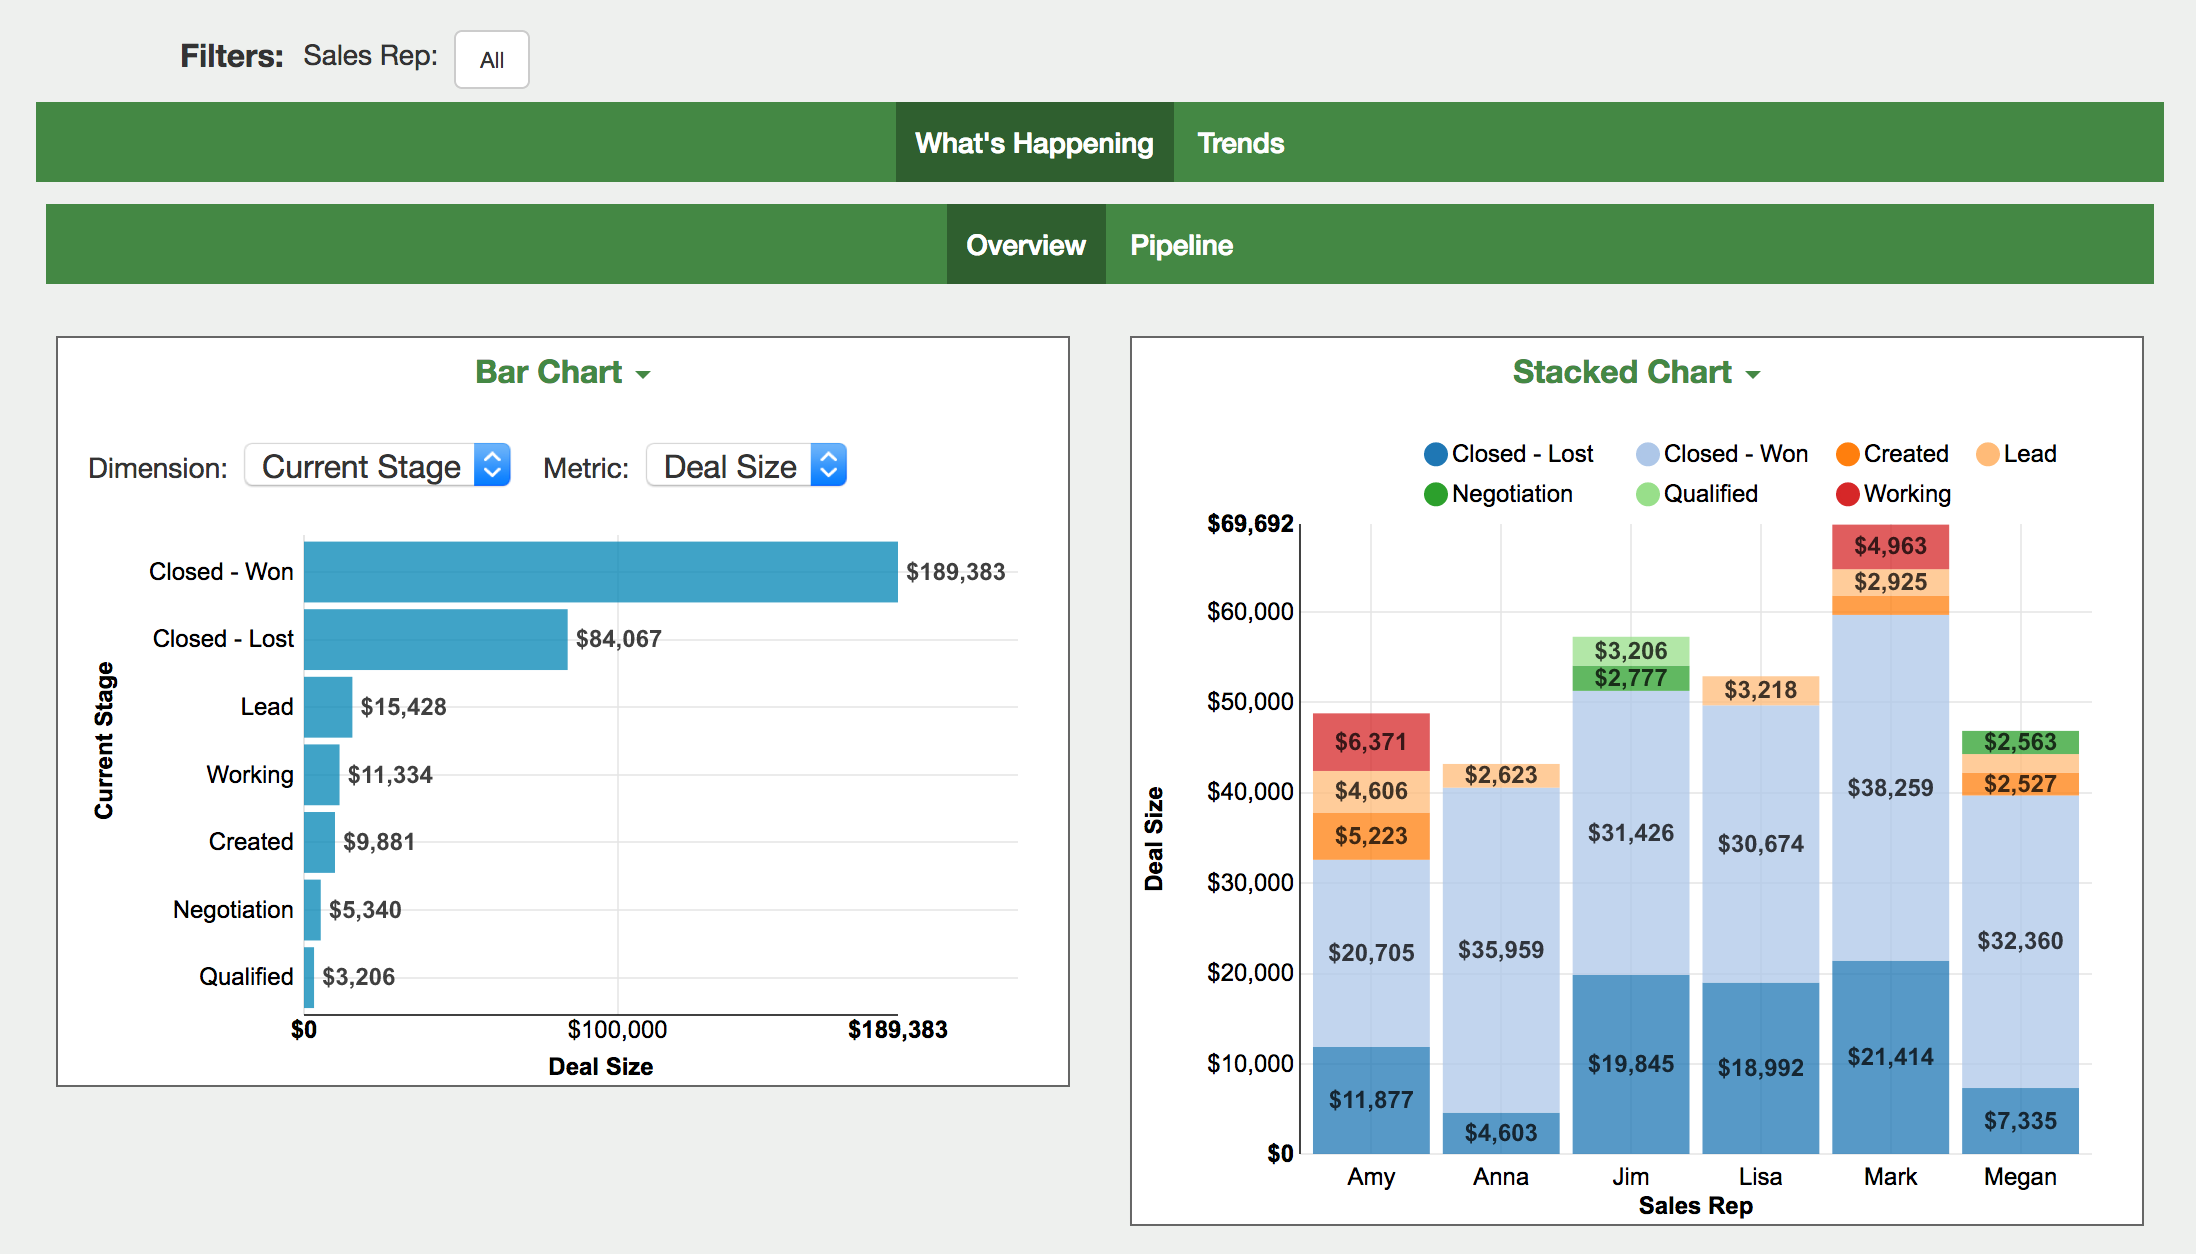
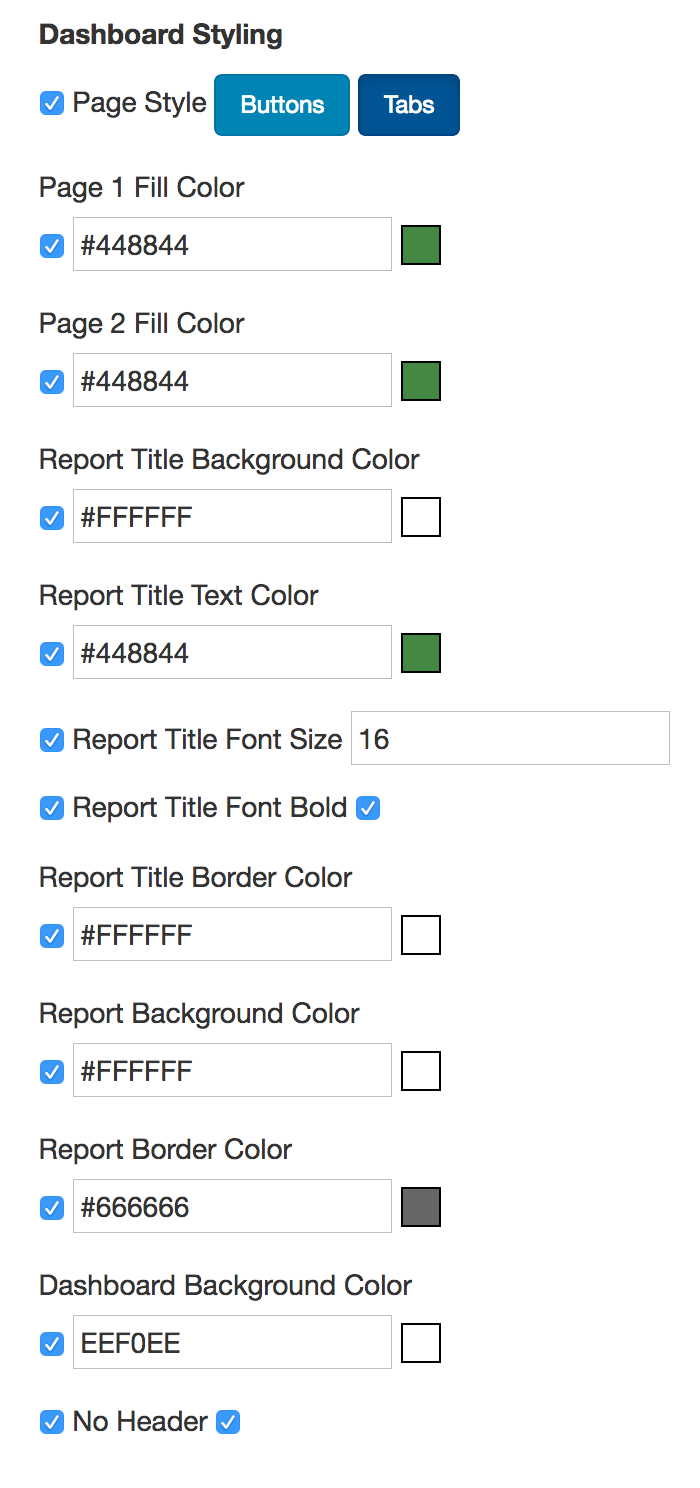
In this next example, the page tabs and report title color are changed over to #448844, a dark green. Each report has a background color of #FFFFFF, providing contrast against the background of #EEF0EE specified as the dashboard background color. A report border color of #666666 surrounds each report on the dashboard. In addition, the dashboard header is turned off, reducing the amount of screen real estate needed to show the dashboard.

Distribute Dashboard

Dark Dashboard Backgrounds

You can configure a dashboard to have a dark background with the 'Dashboard Background' options found at the bottom of the Dashboard section. You can set a dark solid color or you can set a gradient. If you set a gradient, you'll need to specify the angle of the gradient, the start color, and the end color. For example, a 90 degree angle will make the gradient flow horizontally from left to right, while a 180 degree angle will make the gradient flow vertically from top to bottom.

Color Scheme Settings

With a dark background, you can configure a solid report background color with the 'Report Background Color' setting. You can also configure the opacity of the report background with the 'Report Background Opacity' setting, going from 0 for fully transparent to 1 for fully opaque.

If you enable a dark background on your dashboard, reports will adjust to show text, chart grids, and other foreground elements in a light color to ensure contrast.

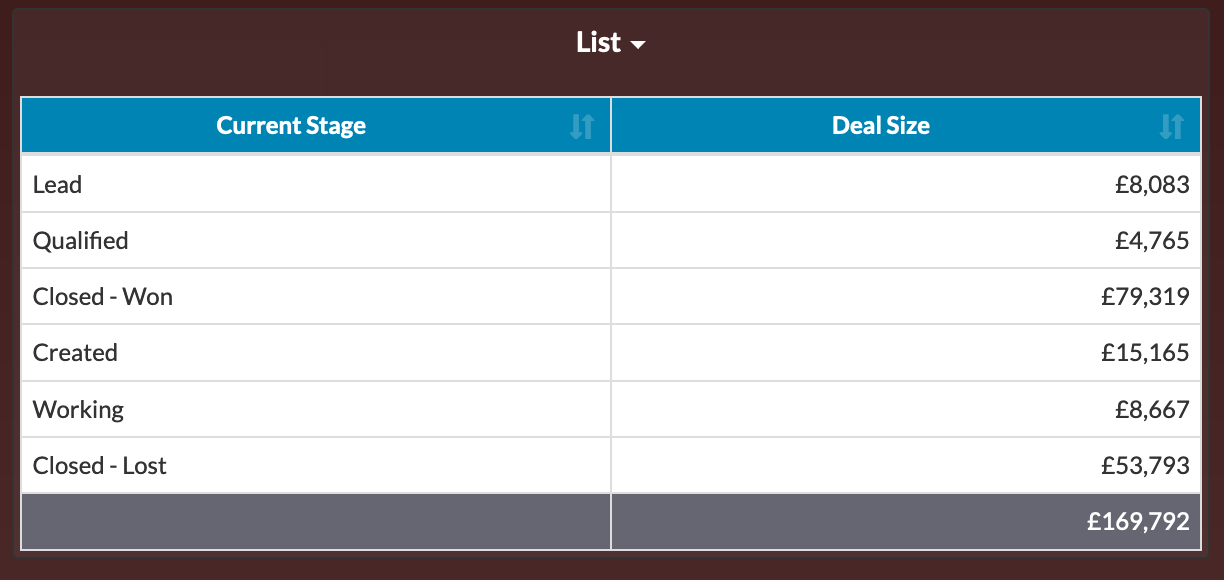
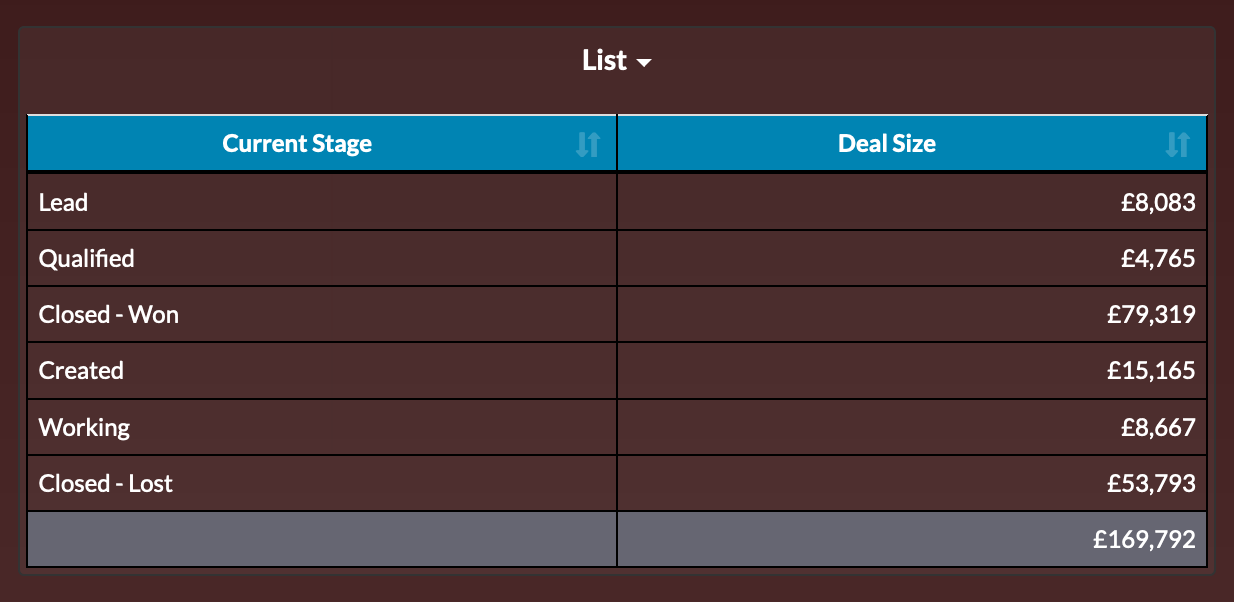
By default, list and crosstab reports will still show on a white background with a dark background dashboard. If you want the tabular reports to show with a dark background instead, toggle the 'Tables to Dark Mode' setting.

Color Scheme Settings

Section Styles

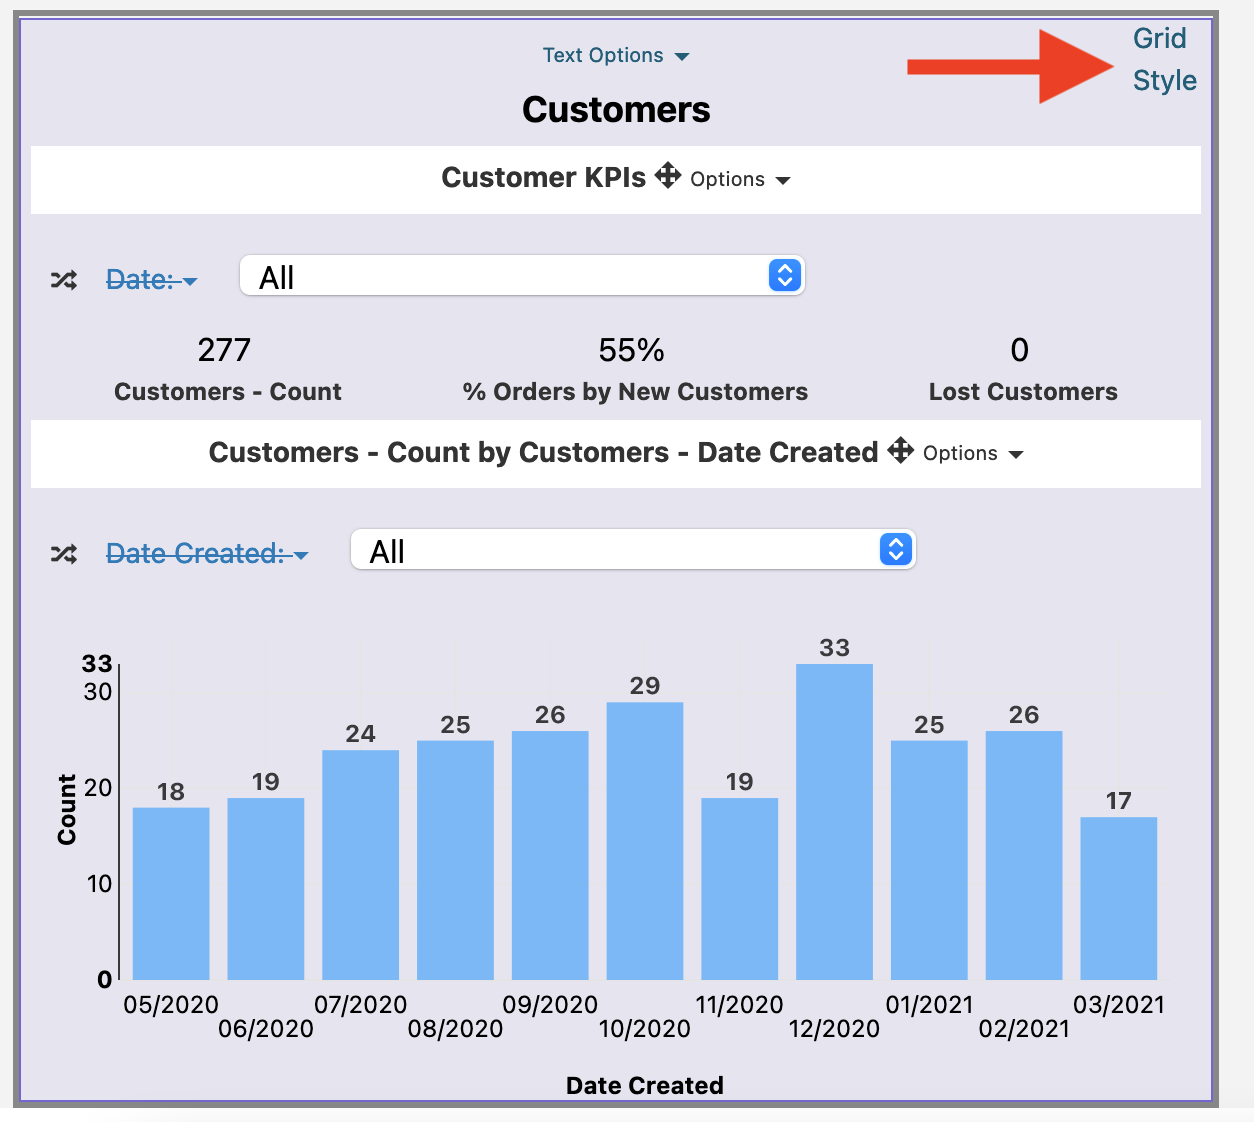
You can customize the style of a particular section of a dashboard, not just a single report. When you hover over the dashboard in the editor, you'll see a 'Grid Style' link in the upper right of a given section:

Section Configuration

Click on the link to customize the appearance of that section. You can add a border color to a section as opposed to just a report, and make different sections on your dashboard pop visually with different background colors.

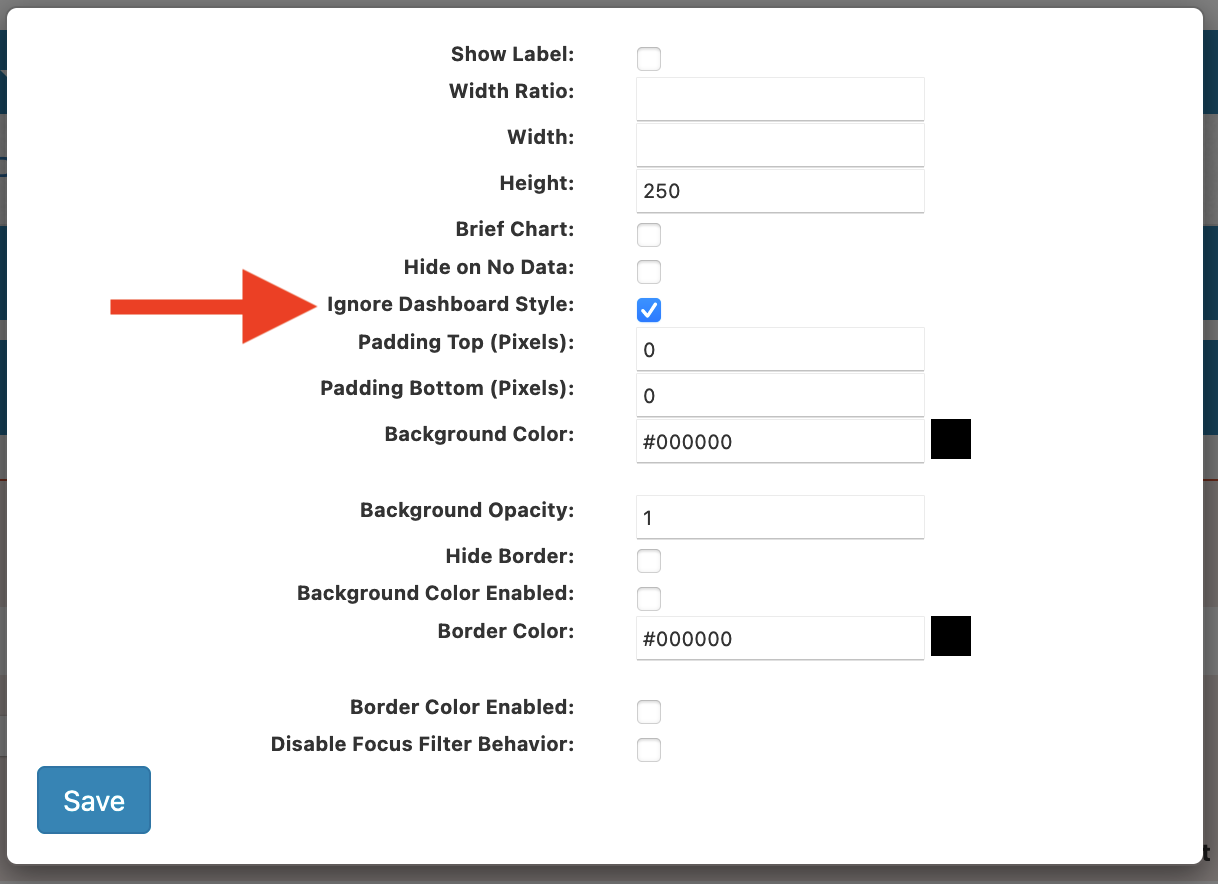
You can toggle off the style of reports within a grid by choosing 'Ignore Dashboard Style' within the report options so that a report will seamlessly fit into the section styling you've set up:

Section Configuration

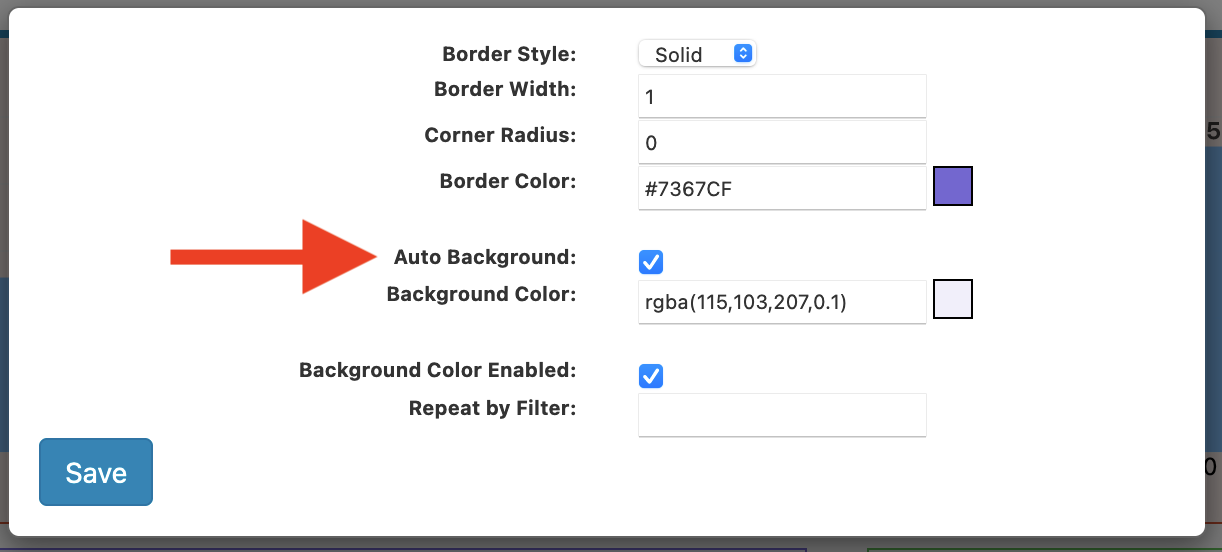
You can also set up automatic styles for different sections based on your account skin. From the Grid Style window, choose 'Auto Background':

Section Configuration

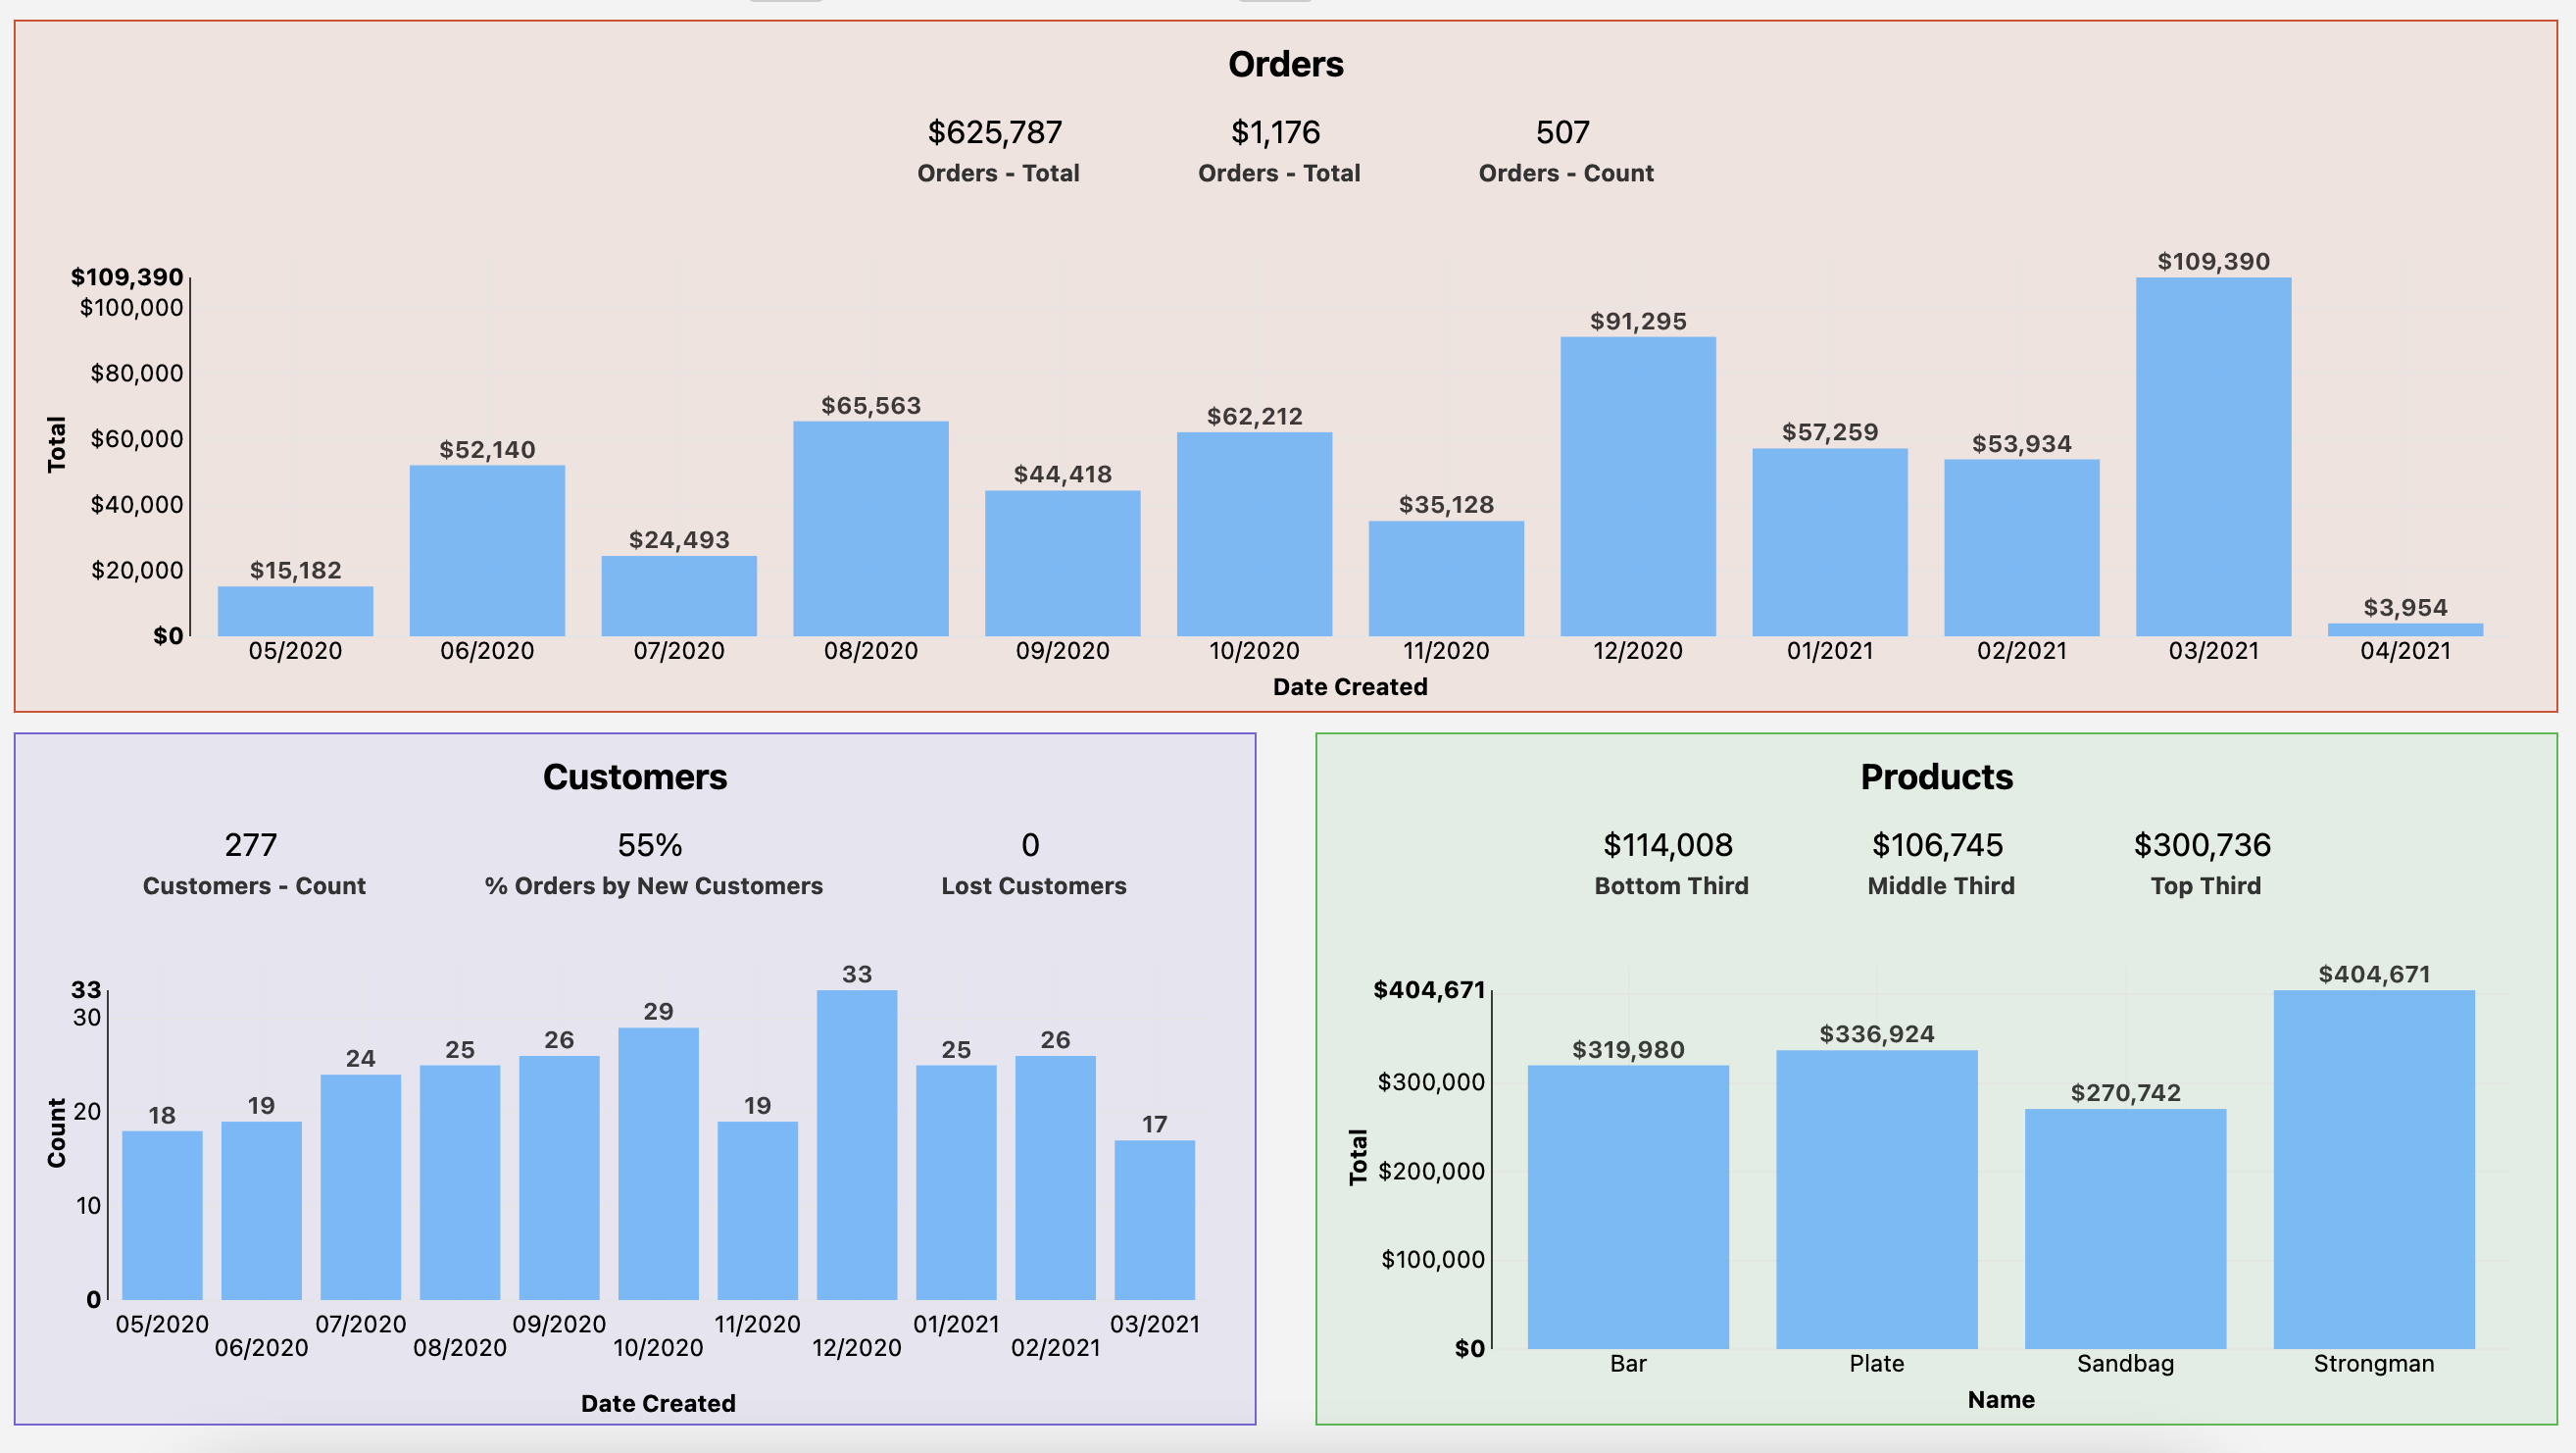
The section will automatically choose colors from your chart multi colors in the account skin:

Section Configuration
RESOURCES
Twitter Logo