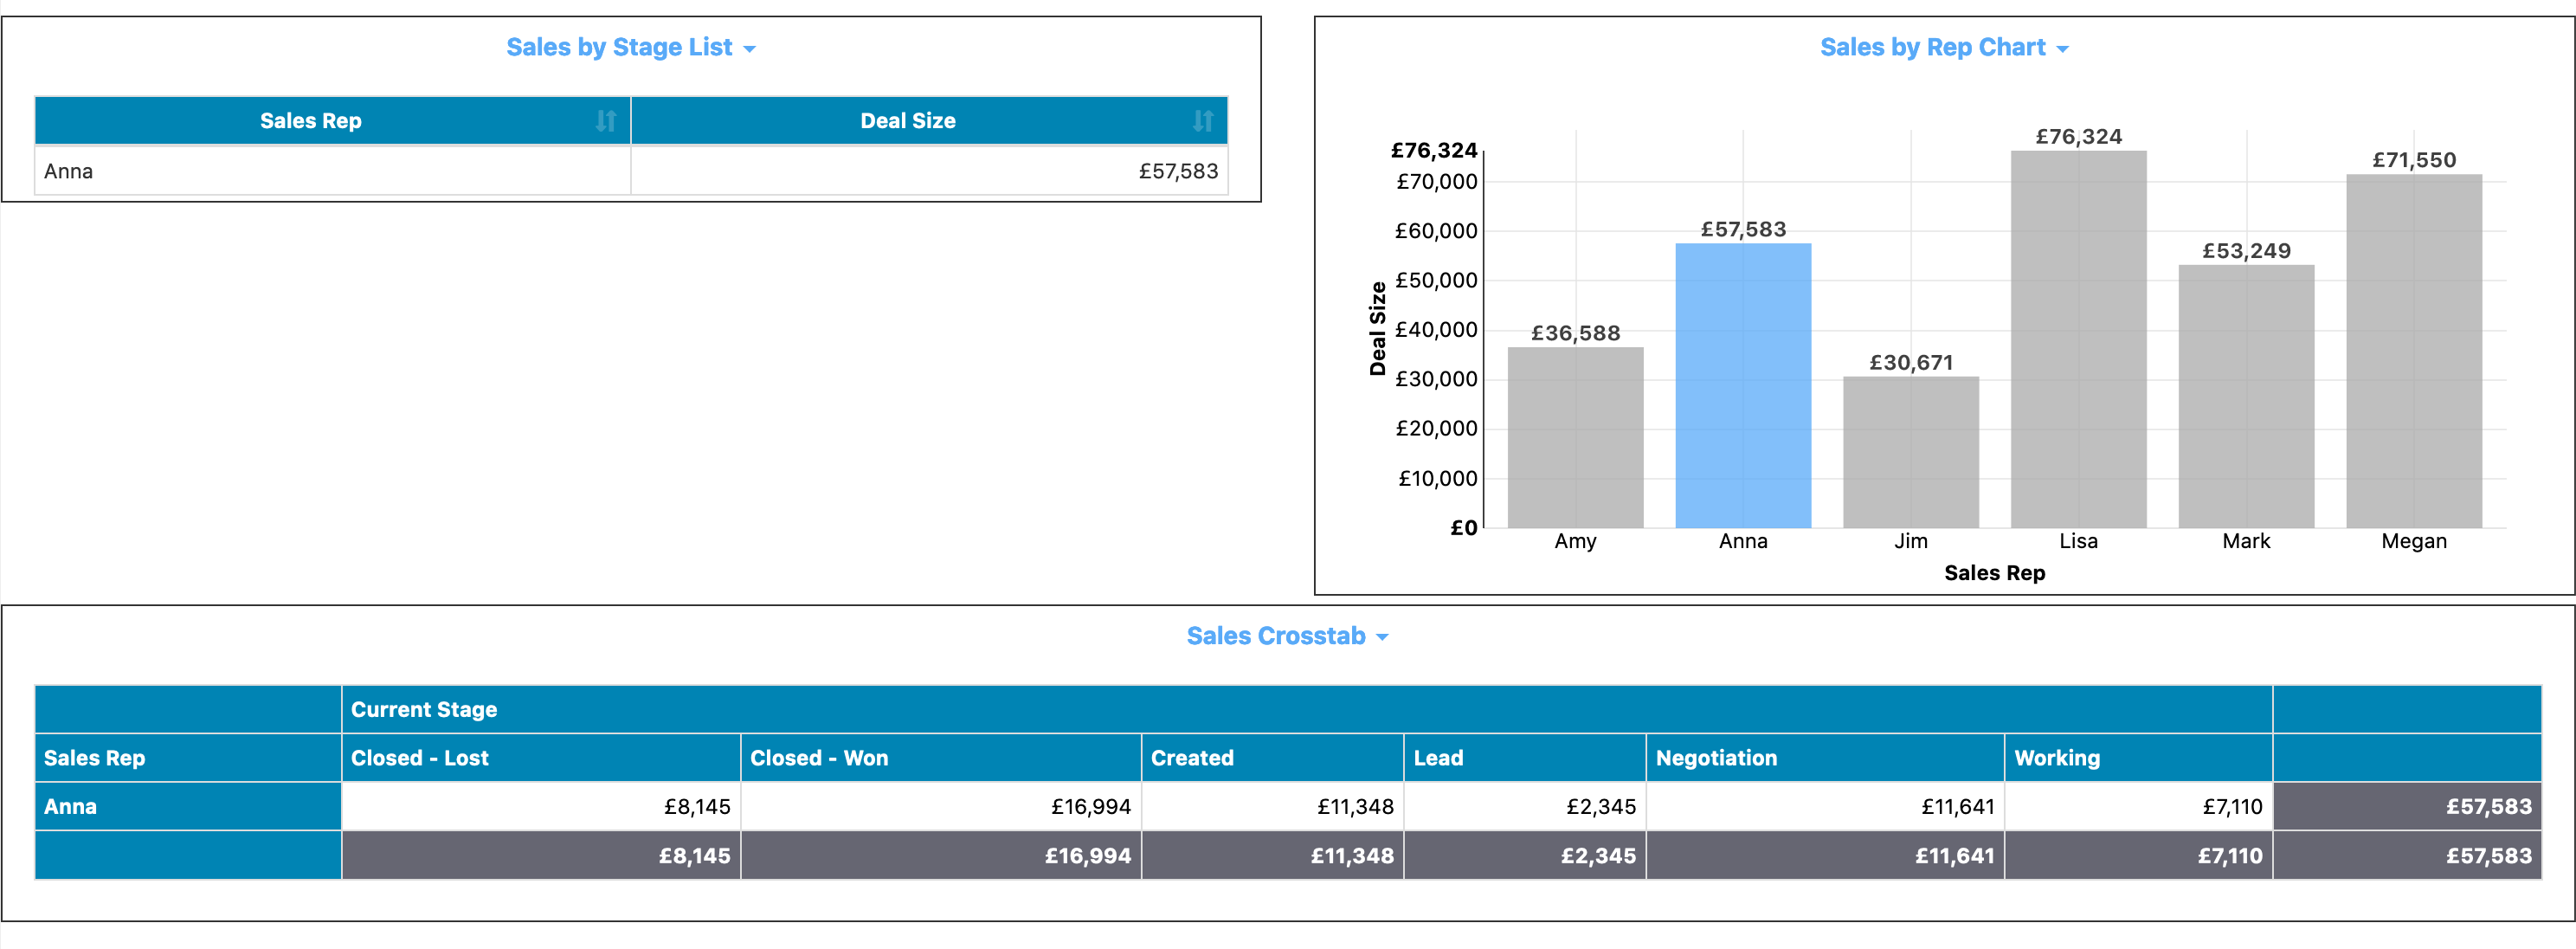
Want the other reports on a dashboard page to change when you click on a value in one report? For example, you might have a list, a crosstab, and a second chart automatically filter down when you click on a chart bar. You can enable this behavior through dashboard focus filters, giving you dashboards like the following:
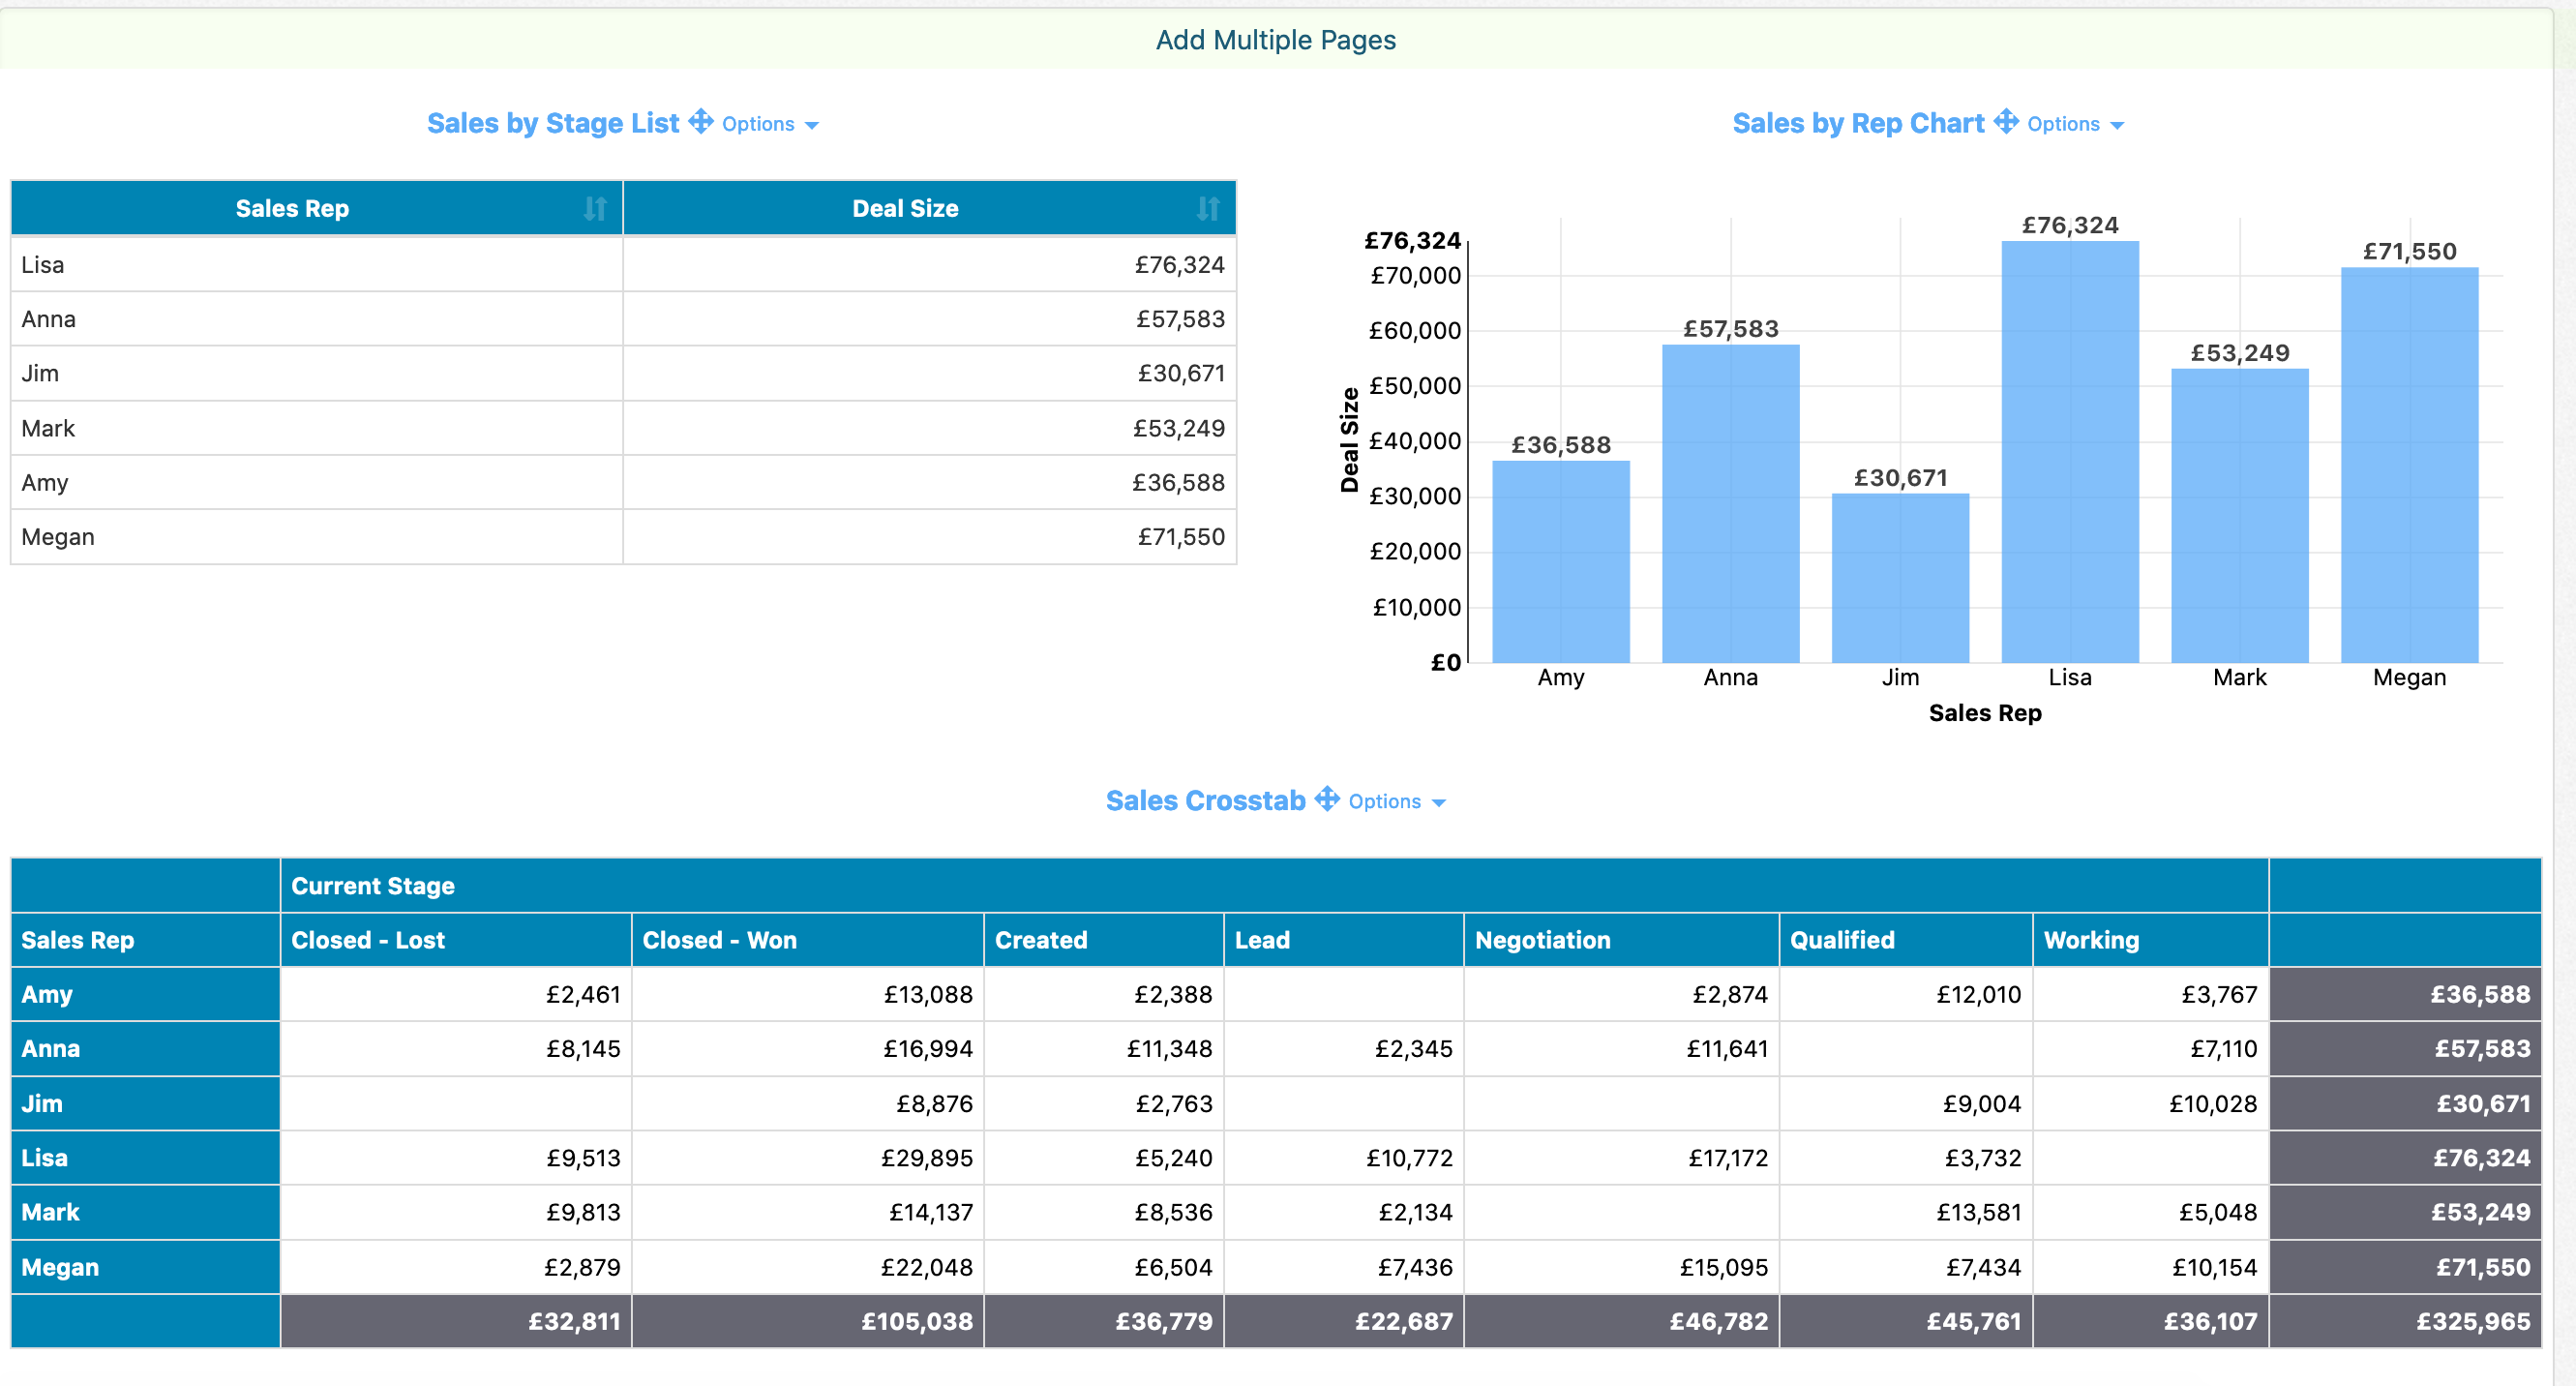
To start with, you'll need a single page of reports on a dashboard. For examxple, if you have a simple dashboard with a grid of reports as shown:
You'll want to click on 'Add Multiple Pages'. The end version of the dashboard won't show tabs since there's only a single tab, but the page behavior is still enabled. If you have multiple pages already as shown:
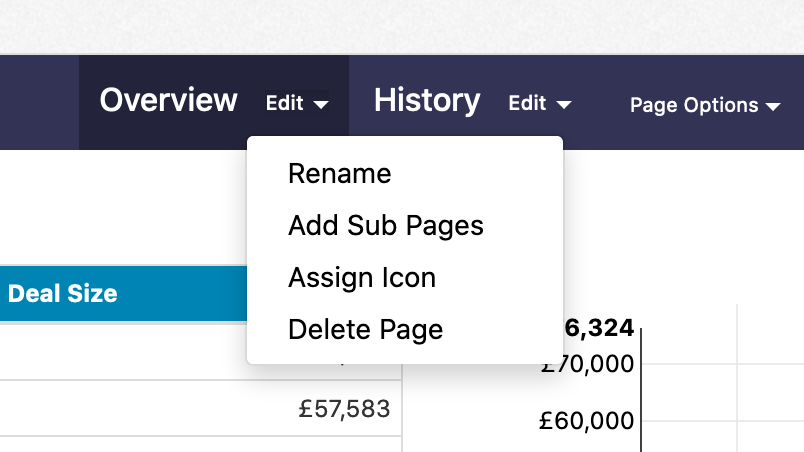
Click on the Edit link next to the page you want to enable focus filters on and do 'Add Sub Pages'. Again, the end version of the dashboard won't show the tabs since there's a single tab, but the page behavior is now enabled as well.
Once you have your page set up, you can click on the 'Page Options' link and do 'Edit' to pull up the set of page properties. Toggle the 'Dynamic Focus Filters' setting to On, then save your dashboard and navigate to the end user view.
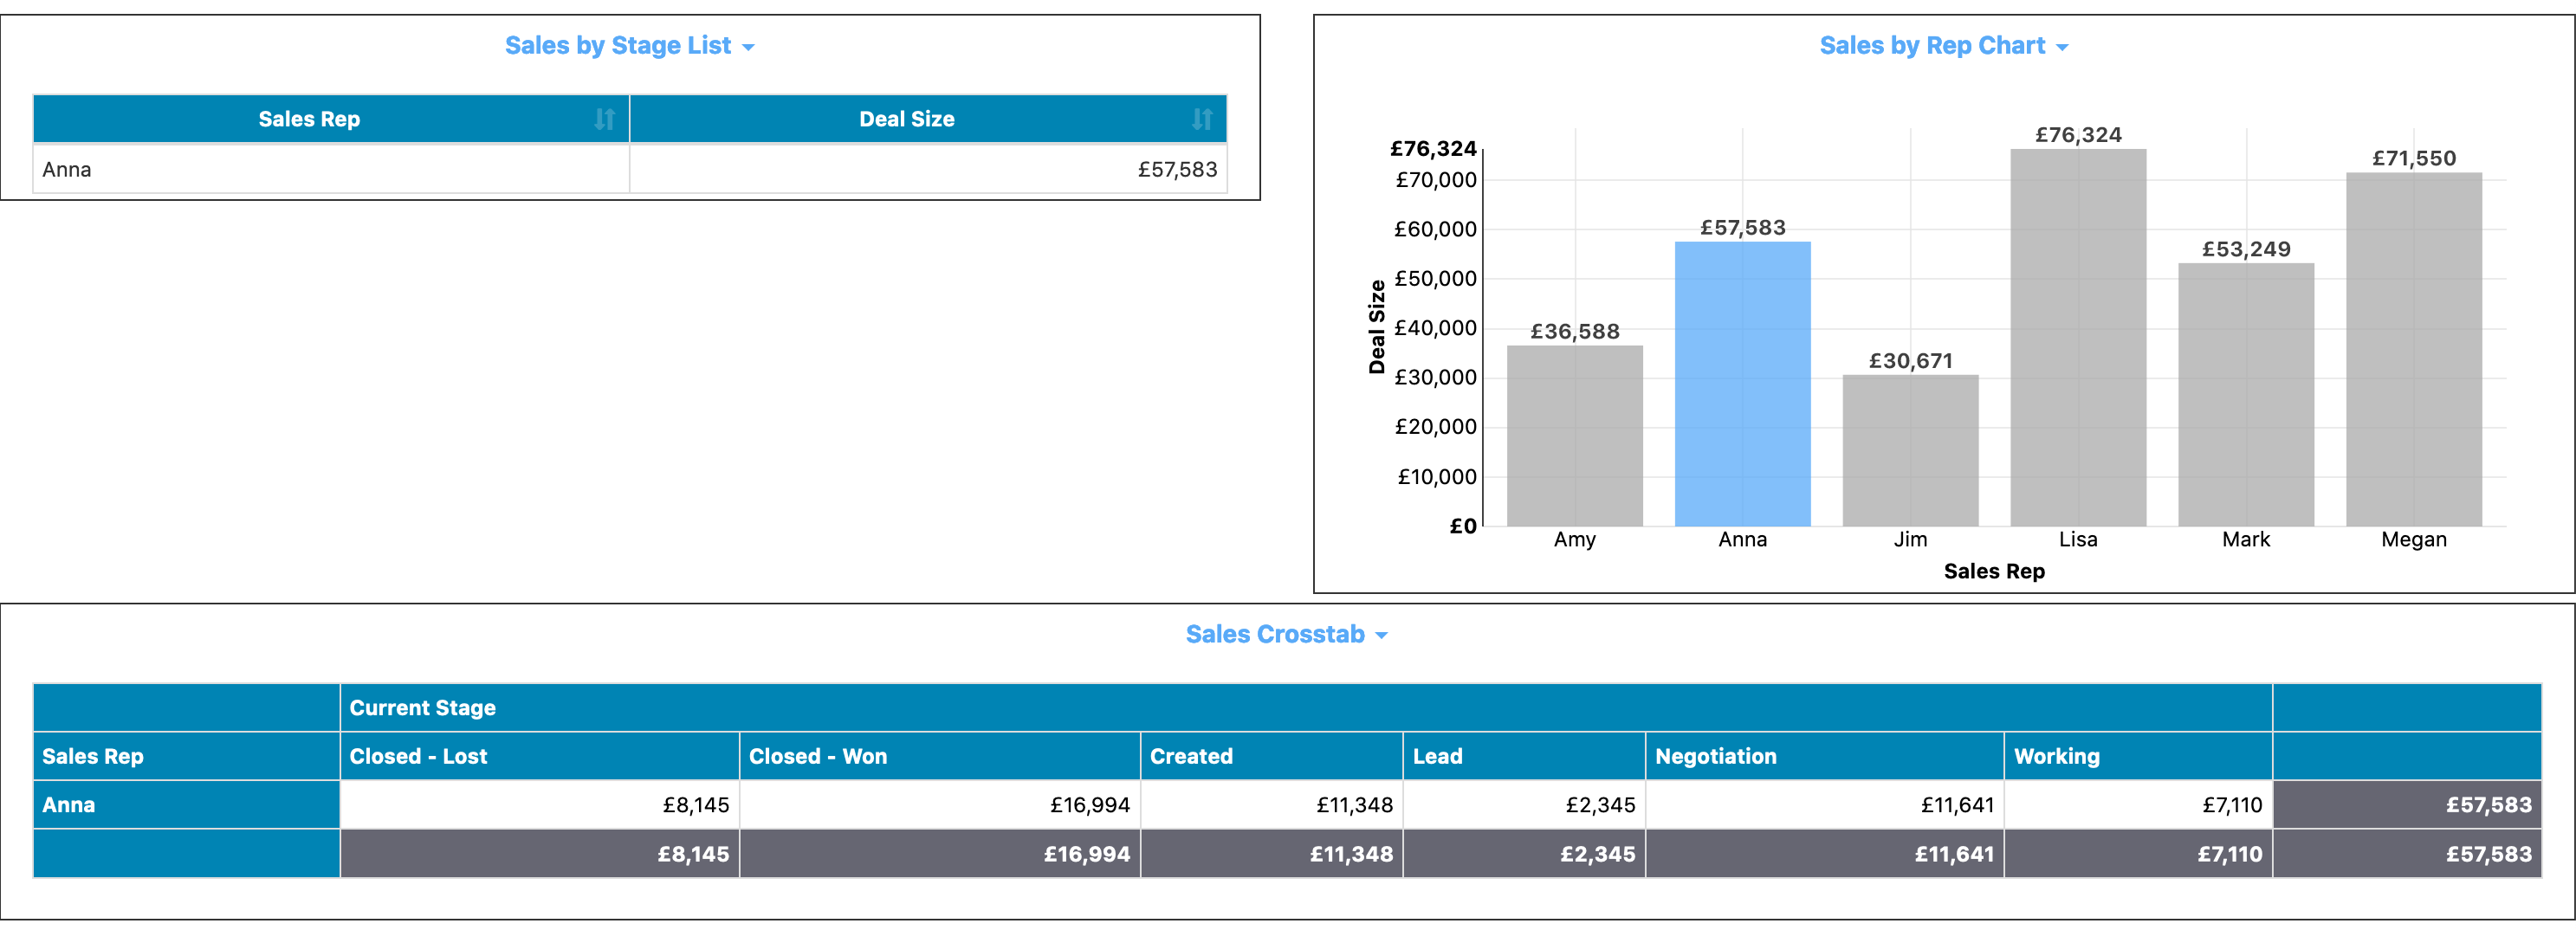
In this example, when we click on one of the bars in the column chart in the upper right, the other bars on the report gray out. The other reports in the dashboard automatically filter down based on that selection:
Clicking on a different bar on the column chart changes the focus. Clicking on the same bar again clears the focus and displays everything again.
if you want to disable focus filtering on a particular report on the dashboard, open up the dashboard in the dashboard editor again. Click on the Options link next to the report, click on Properties, and check 'Disable Focus Filters'. Save the dashboard and clicking on the report won't use the focus filter behavior.