Easy Insight has a variety of dashboard options that you can take advantage of:
You can display the last refresh time of the data source on the dashboard to help users understand when the data they're looking at is from. From the dashboard editor, click on Configuration, Dashboard Properties, then find 'Show Last Refresh' under the Collaboration tab:
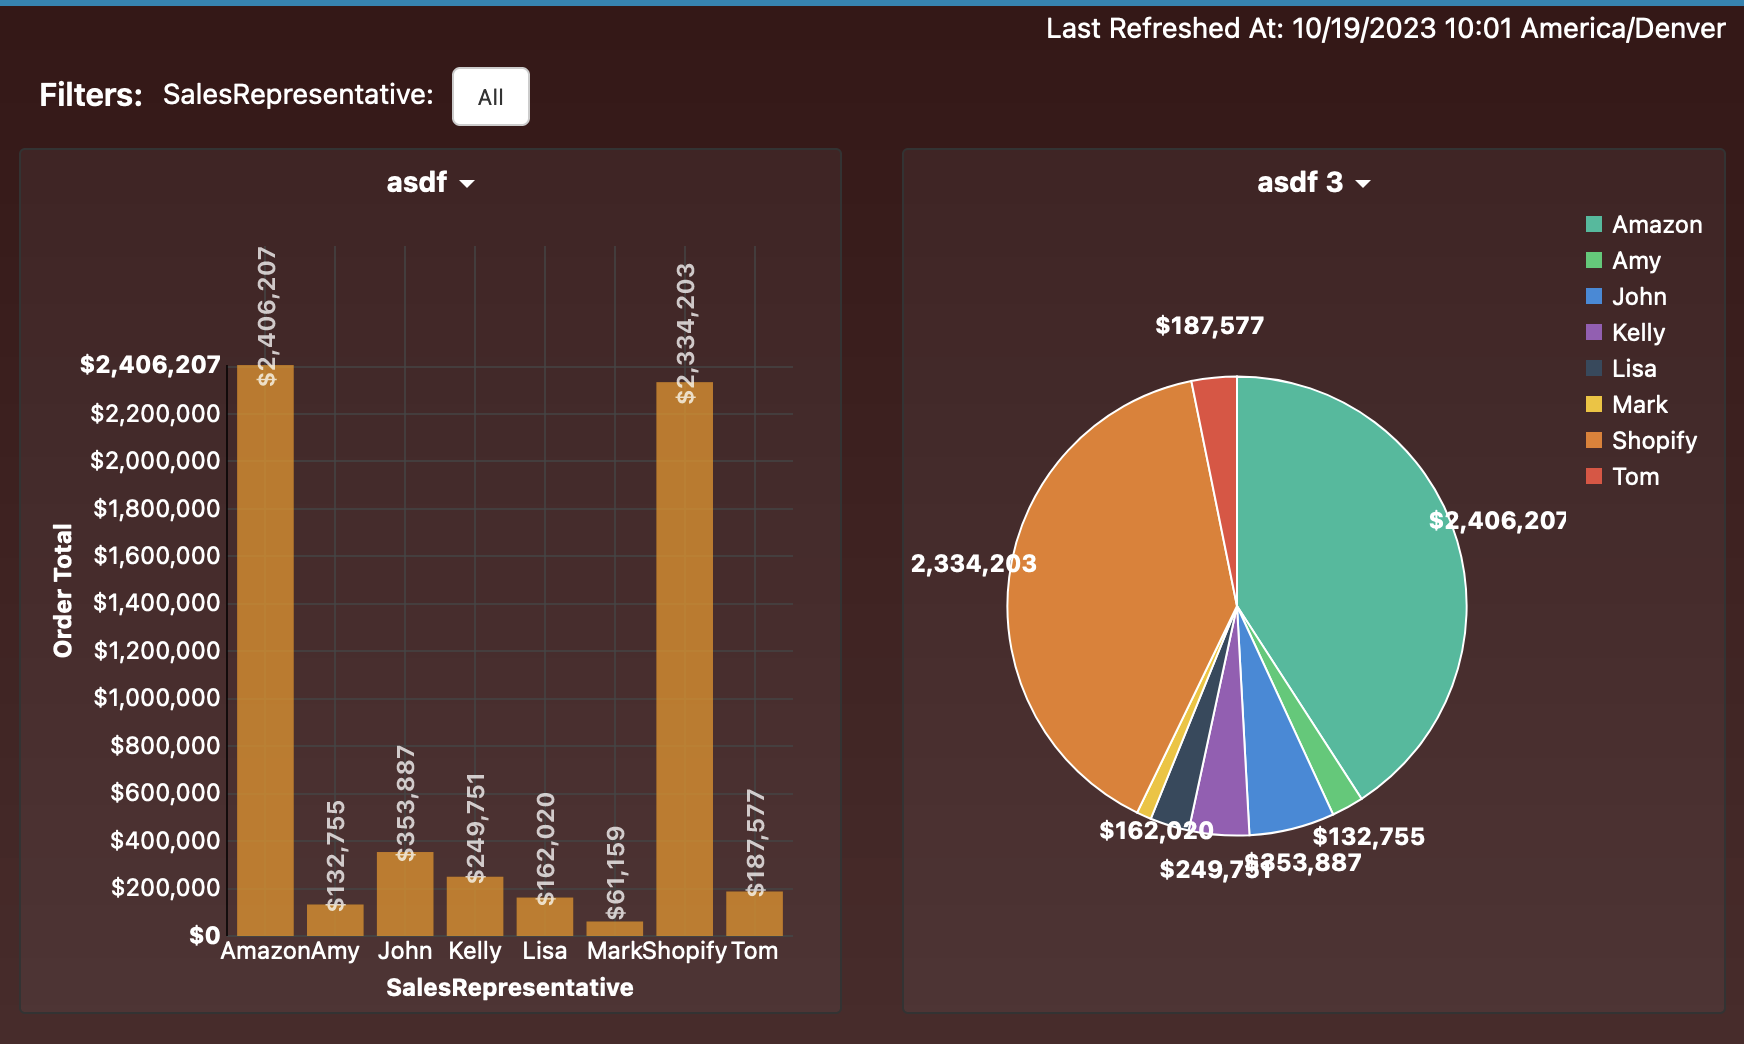
Once enabled, you'll see the last refresh date of the data source shown in the upper right corner of the dashboard:
You can set the dashboard to show report performance information and audit information about how the report filters interacted wtih the dashboard filters. From the dashboard editor, click on Configuration, Dashboard Properties, then find 'Track Peformance and Audit Information' under the Collaboration tab:
Once enabled, you will see two new options when you click on a report title from the dashboard view, Explain Filters and Performance.
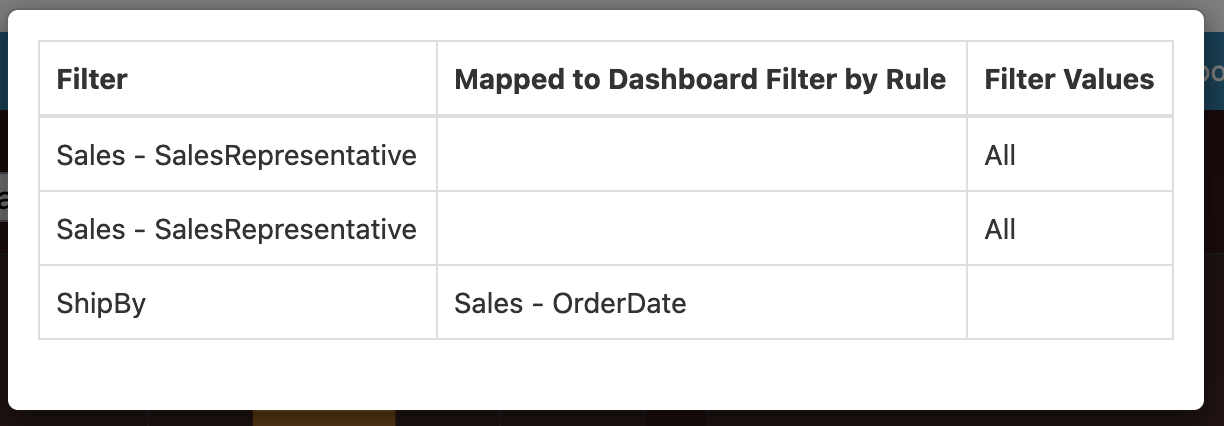
The 'Explain Filters' option will explain how it linked any report filters with dashboard filters. If you're having trouble getting filters to do what you're looking for, this option can help you to understand what's going on in the dashboard:
The 'Performance' option will report on how long it took to run the report in the dashboard and break down the elapsed time into certain categories. You can use this to help identify what might be slowing down a report:
By enabling page navigation by URL, the URL in the browser bar will update as you change pages within the dashboard. This way, you can copy the link to a specific page on the dashboard for sharing with your team. To enable page navigation by URL, click on Configuration -> Page Navigation by URL from the dashboard editor:
Once enabled, you'll see that the browser URL changes as you navigate between tabs in the View screen of the dashboard. You can copy and share these URLs with your team.