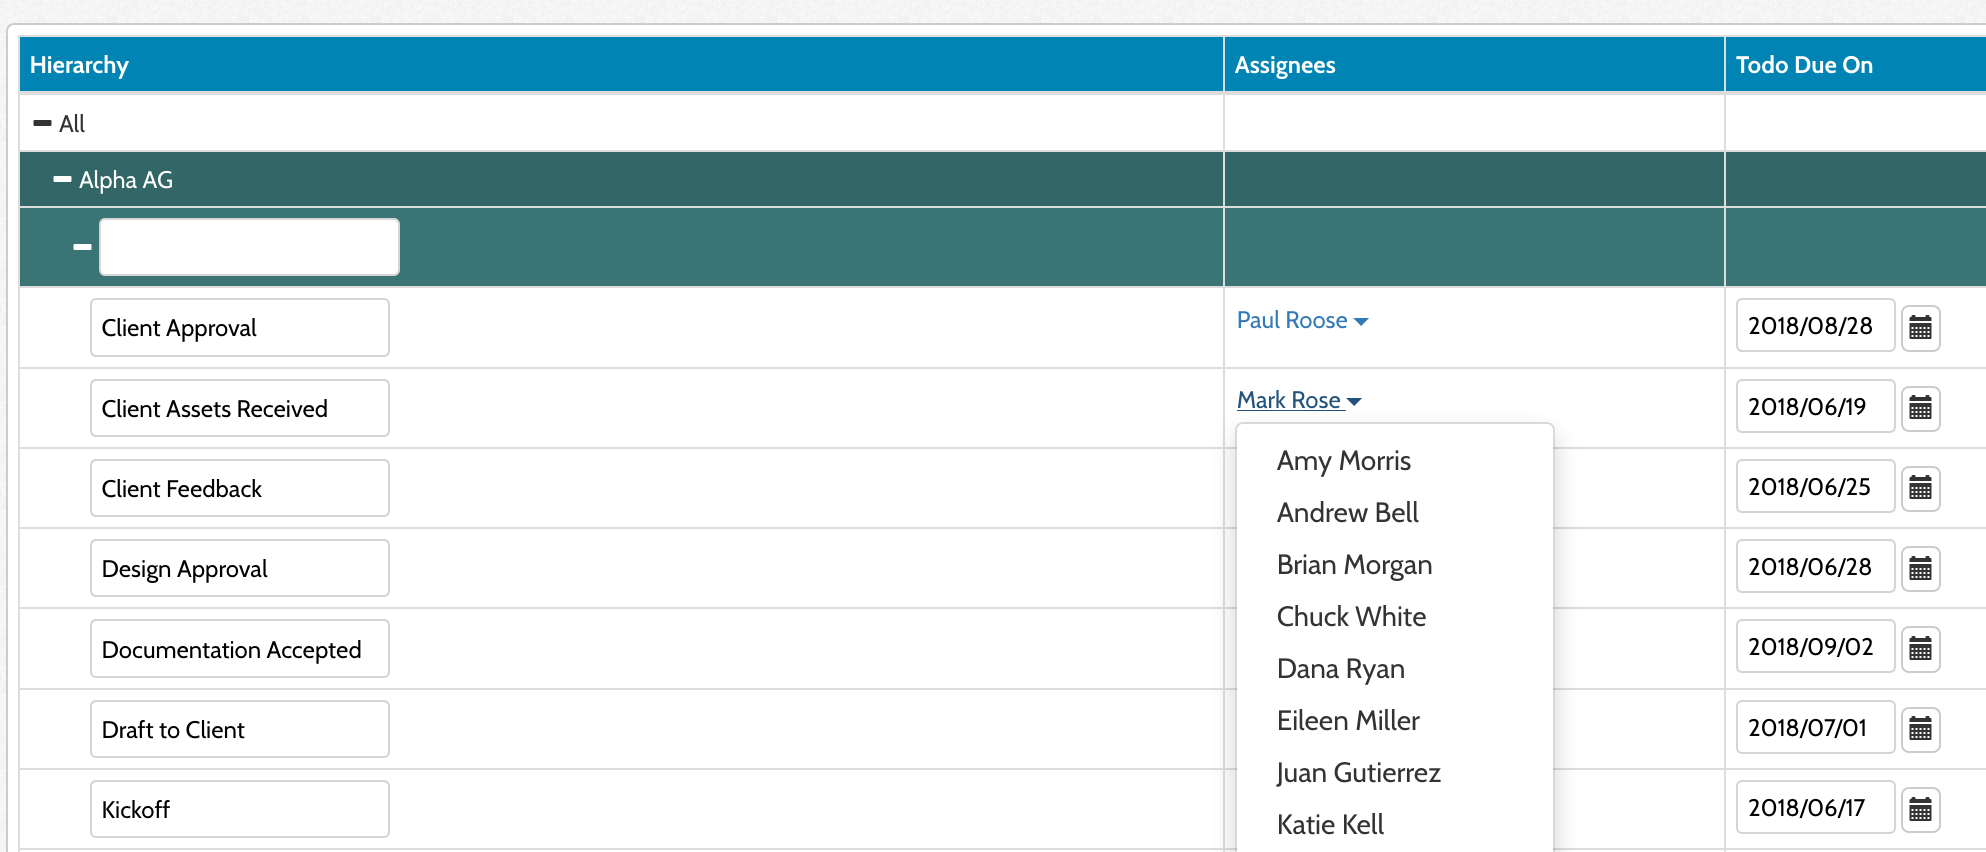
Two way reports enable you to change data directly from your report. You can see examples below:
You can configure lists, trees, boards, and forms as two way reports. To get started, choose the report type as you normally would. At the bottom of the report type selection screen, you'll see the four options that support two way functionality:
From here, you can configure the report. In general, it will work the same way as any other report. The key difference is that you'll need to include a Label or ID field for the data source involved.
Basecamp | ||
Todos | Todo Name | Todo ID |
Todo Lists | Todo List Name | Todo List ID |
Freshdesk | ||
Ticket | Ticket ID | |
Highrise | ||
Deals | Deal Name | Deal ID |
Parties | Party Name | Party ID |
Hubspot | ||
Companies | Company Name | Company ID |
Contacts | Contact Name | Contact ID |
Deals | Deal Name | Deal ID |
Pipedrive | ||
Deal | Title | Deal ID |
Pivotal Tracker | ||
Story | Story Name | Story ID |
Quickbase | ||
(Each Table) | Record ID# | |
Teamwork CRM | ||
Companies | Company Name | Company ID |
Contacts | Contact Name | Contact ID |
Deal | Deal Name | Deal ID |
Teamwork Desk | ||
Tickets | Subject | Ticket ID |
Teamwork Projects | ||
Task | Task Name | Task ID |
Task Lists | Task List Name | Task List ID |
Time Entries | Time Entry ID | |
Trello | ||
Card | Card Name | Card ID |
For Tree reports, you'll need to specify that label or ID field as the 'Base' field:
This field will be the bottom level of your typical hierarchy. You can add the additional upper levels of the hierarchy into the Hierarchy section:
From there, you can add your additional columns as you normally would with a tree report:
And finally, you can add an additional level for a nested field that doesn't match with those additional columns. In particular, we've designed this functionality to support adding an easy way to display the comments nested below a task, opportunity, or ticket:
You'll be prompted to save the report before doing too much else in order to fully enable two way functionality:
With this configuration done, you can start easily changing your data in the source system directly from Easy Insight. You can change text fields and add or adjust dates. If the field has predefined options, it will show as a dropdown of those options:
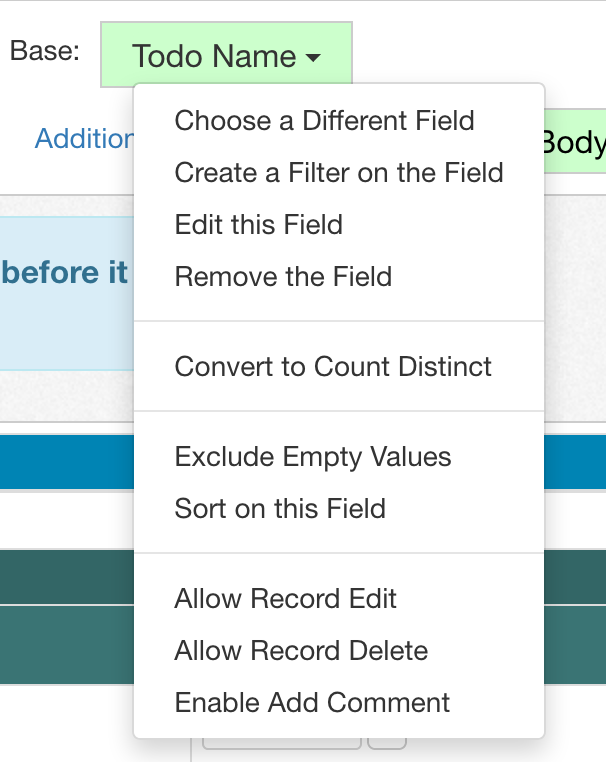
Depending on what the data source allows, you can also enable add, edit, and delete. Click on the label or ID field in the report fields section. For example, clicking on Basecamp's Todo Name field gives us the three options of Edit, Delete, and Add Comment:
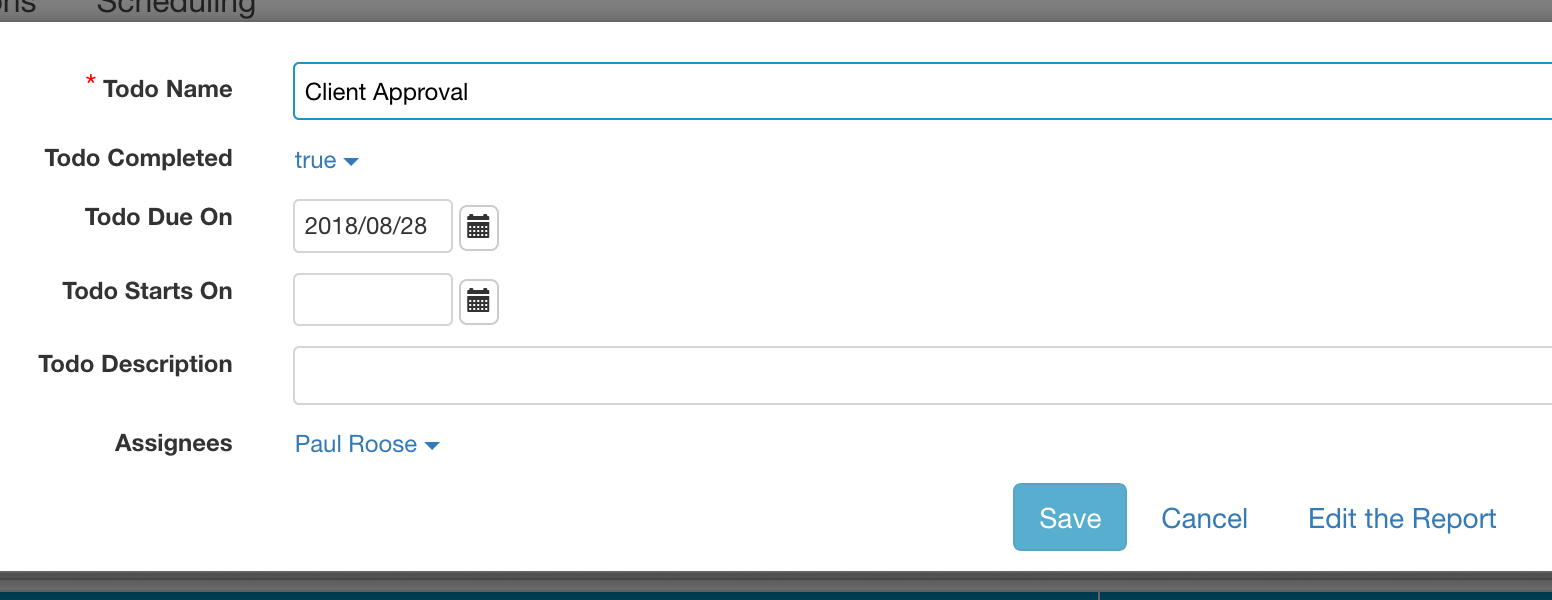
By enabling Edit, you can click on the todo name in the tree to pull up an edit Form report for the todo. This report is automatically generated the first time you click on a todo name after enabling the option. You can customize it by adding additional fields or remove fields that you don't use.
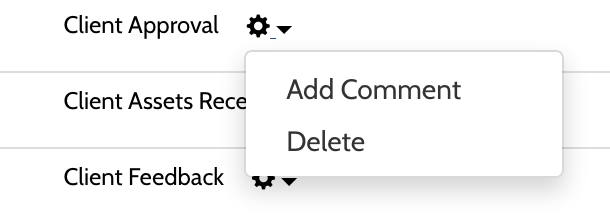
By enabling Delete, the report will show a Delete option for you on the todo:
By enabling Add Comment, the report will show an Add Comment option for you on the todo. When you click on Add Comment, you'll get the same automatically generated form report as used in the edit link:
This same general approach is used for Board reports. With Board reports, the Card field will be your label or ID field. You'll also need to choose a Column field to separate the cards into different columns. You can add any number of additional fields to also display on each card:
You can drag cards between columns to change the value that way, in addition to changing through the edit link.
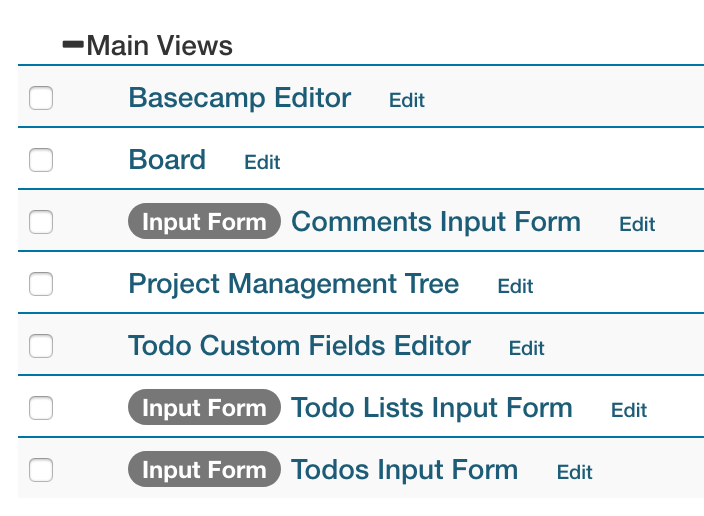
You can edit the fields used in the add/edit form by editing the automatically generated input form reports. The reports will show up in your data source with an 'Input Form' label next to their name, as shown below: