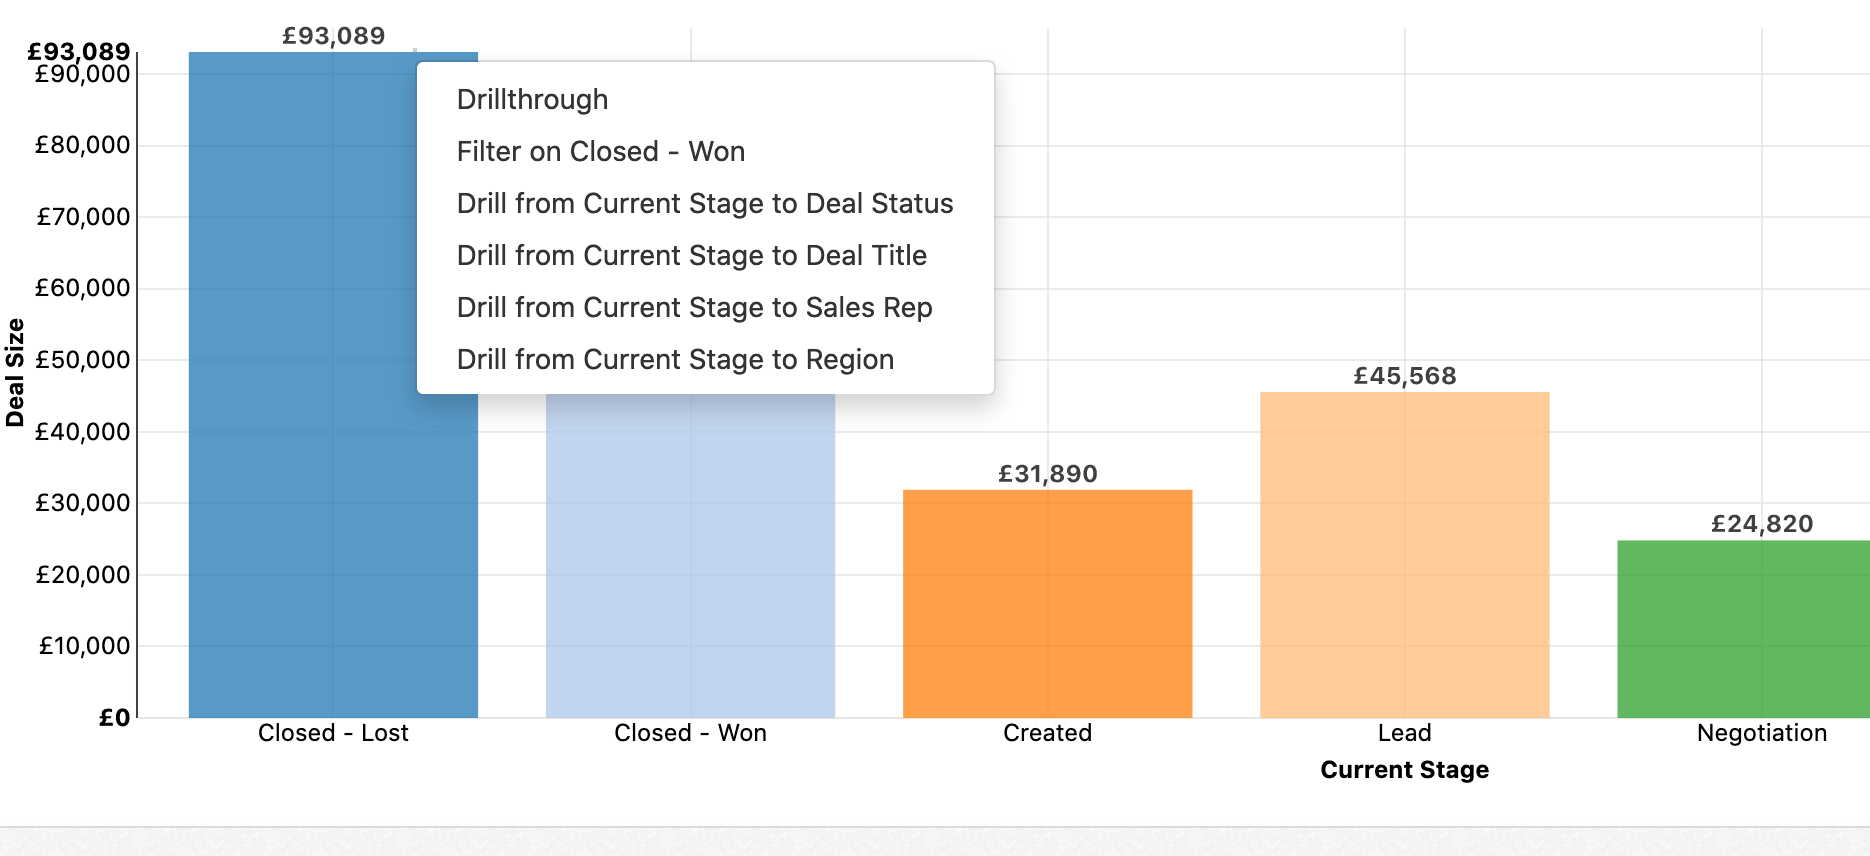
Data exploration enables end users to click on values in reports and dynamically filter down and adjust the field shown, helping to easily analyze different data sets. For example, when a user clicks on a chart column, they might get a context menu like the following:
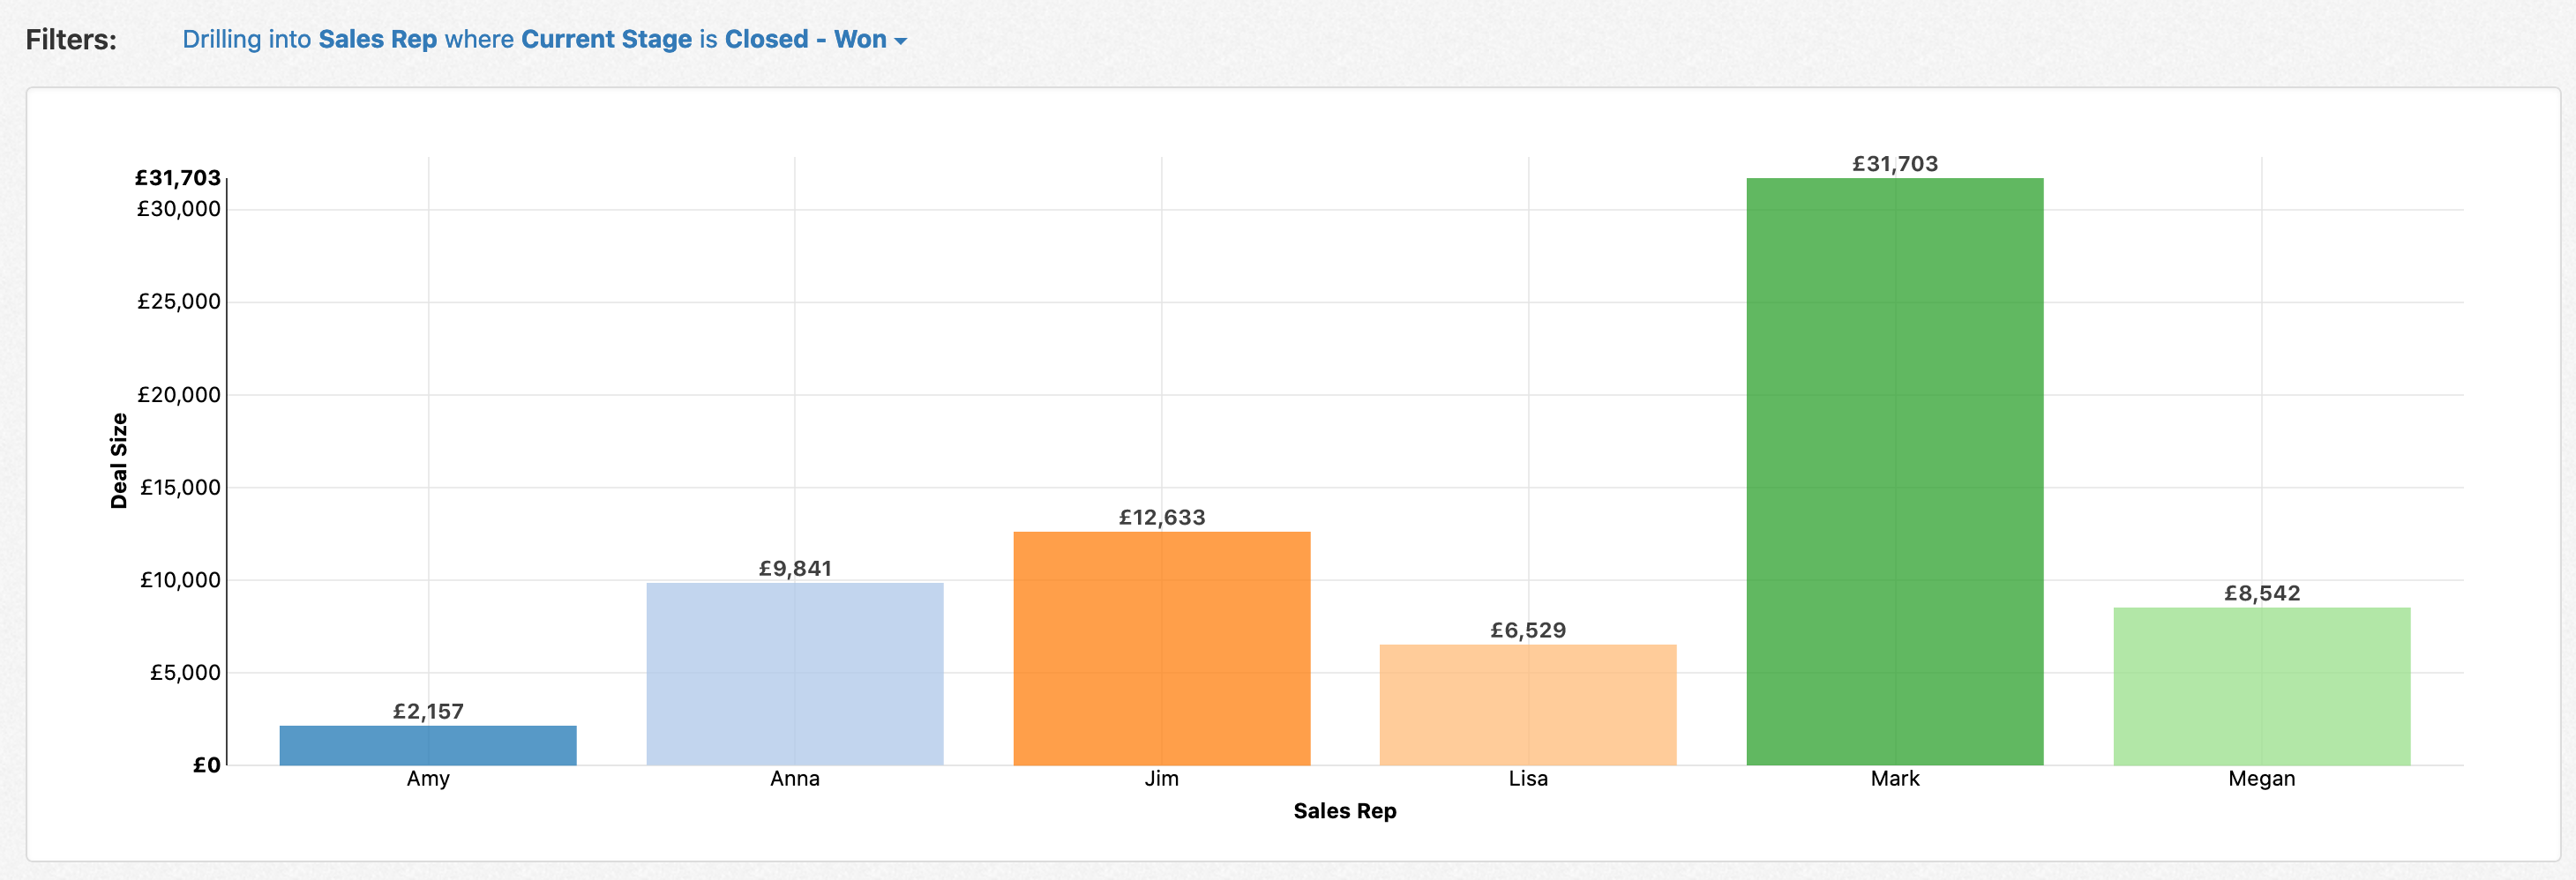
In this example, clicking on Drill from Current Stage to Sales Rep for the Closed - Won column applies a dynamic filter to only show deals that have been won and adjusts the chart to showing a column per sales rep instead of data by stage:
You can configure this behavior through editing the report, clicking on Configuration, and clicking on Explore Data Fields:
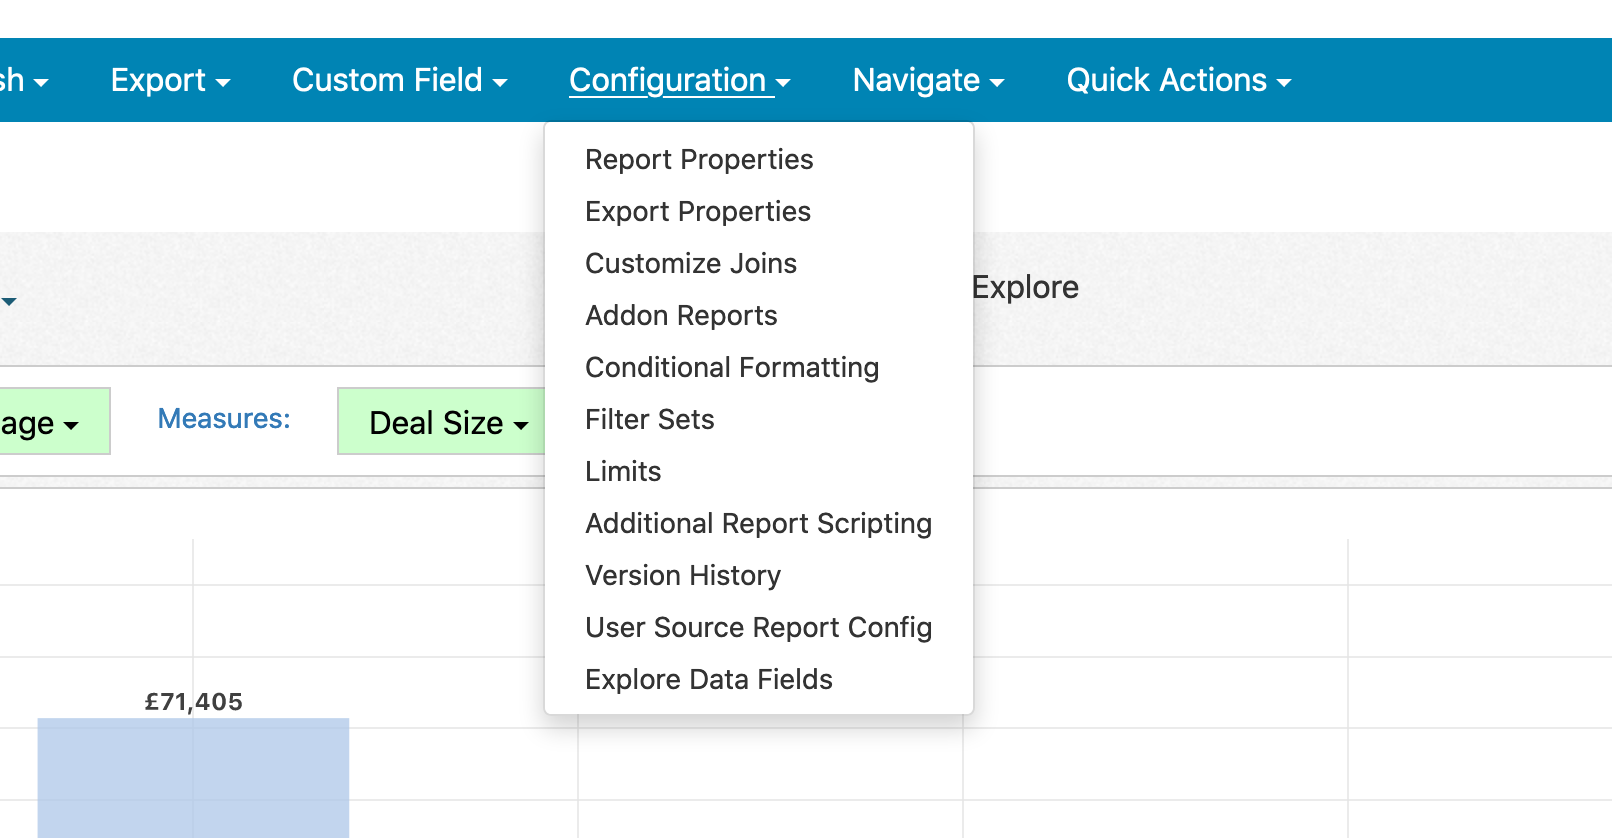
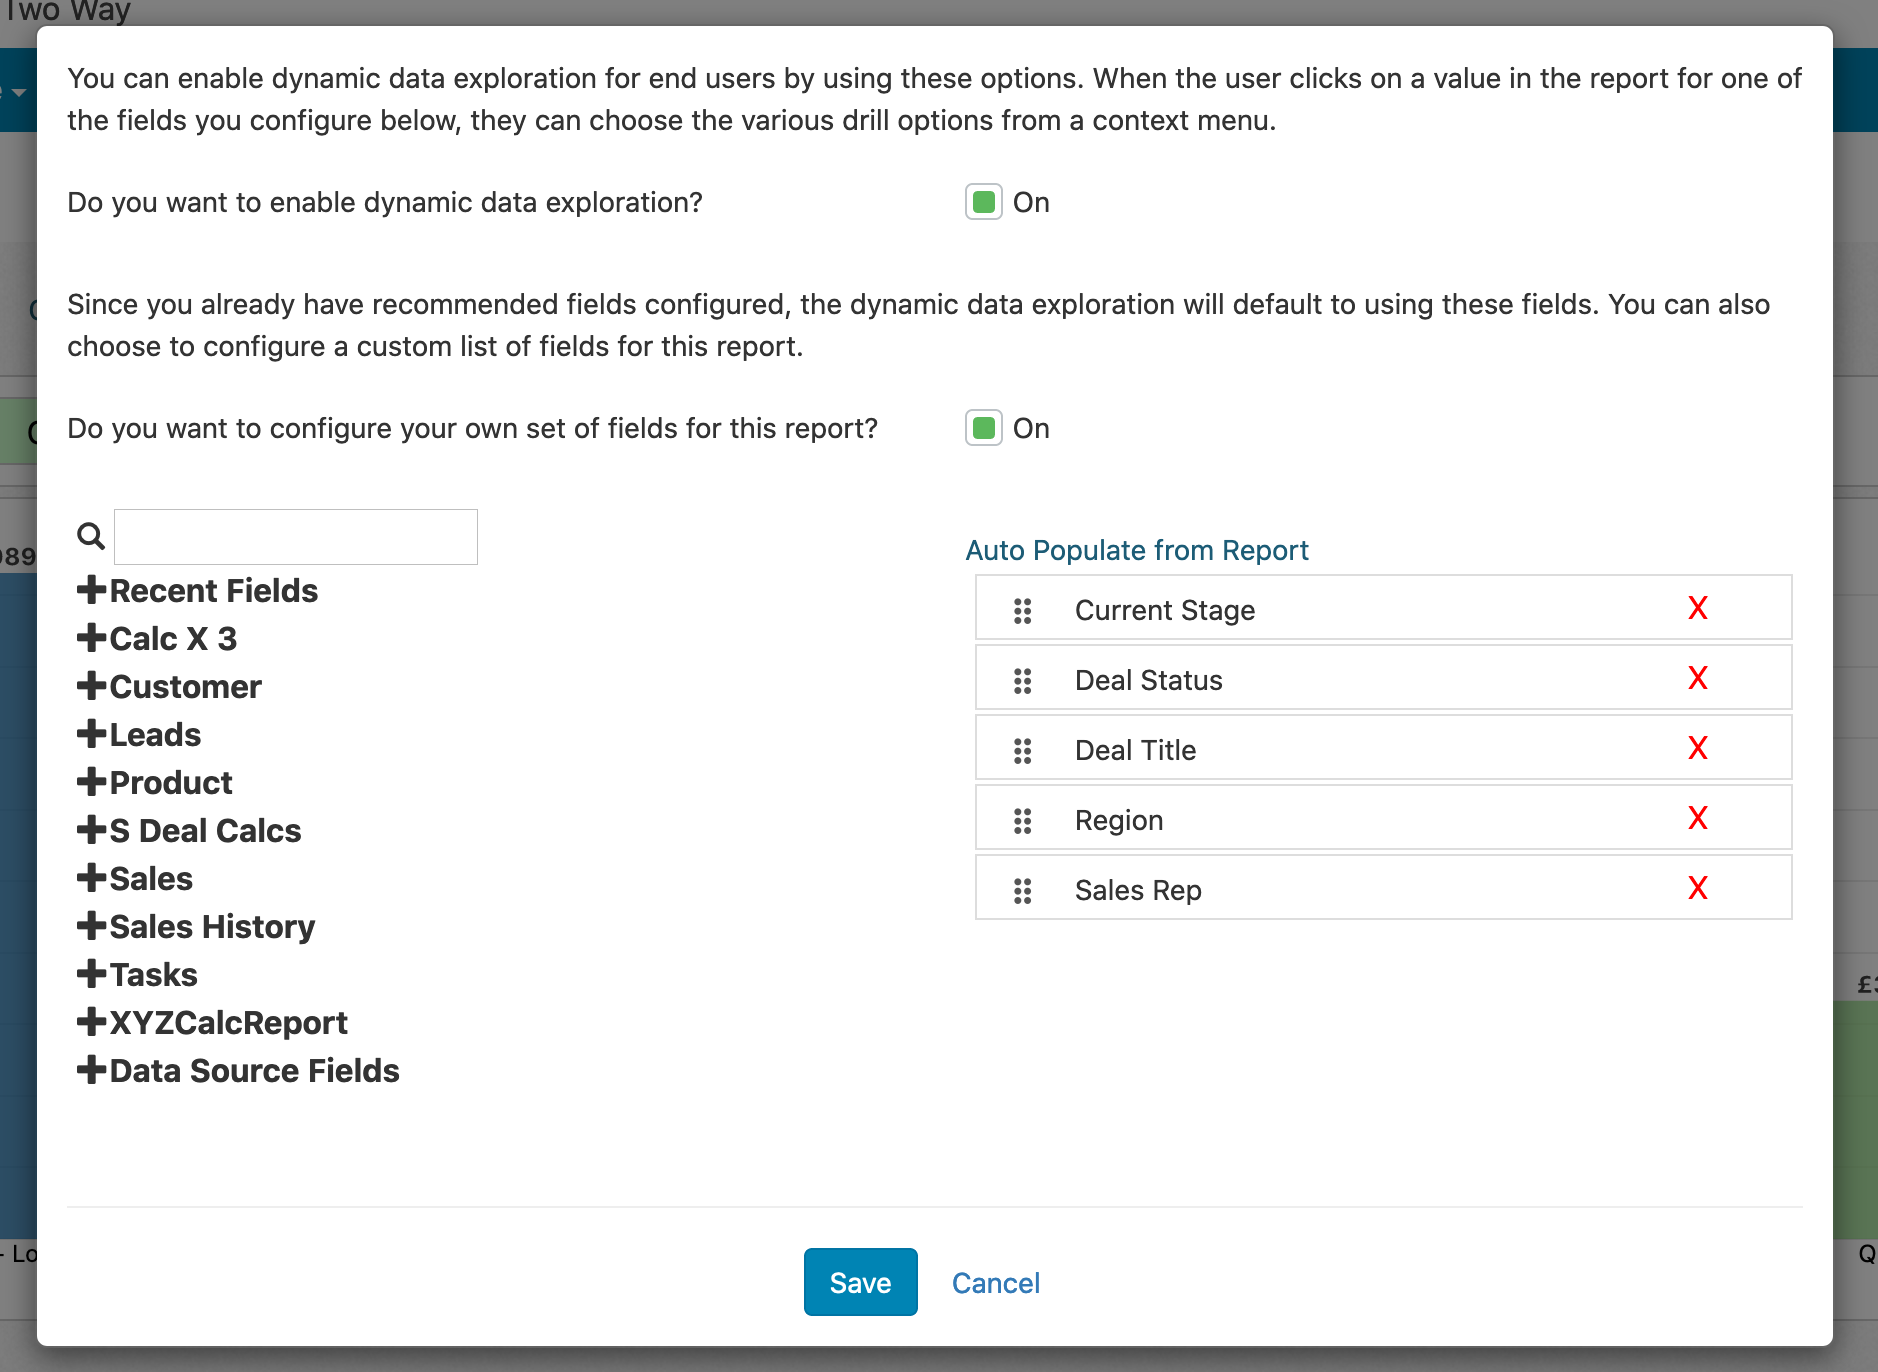
On this window, you can enable the explore data behavior and populate possible fields:
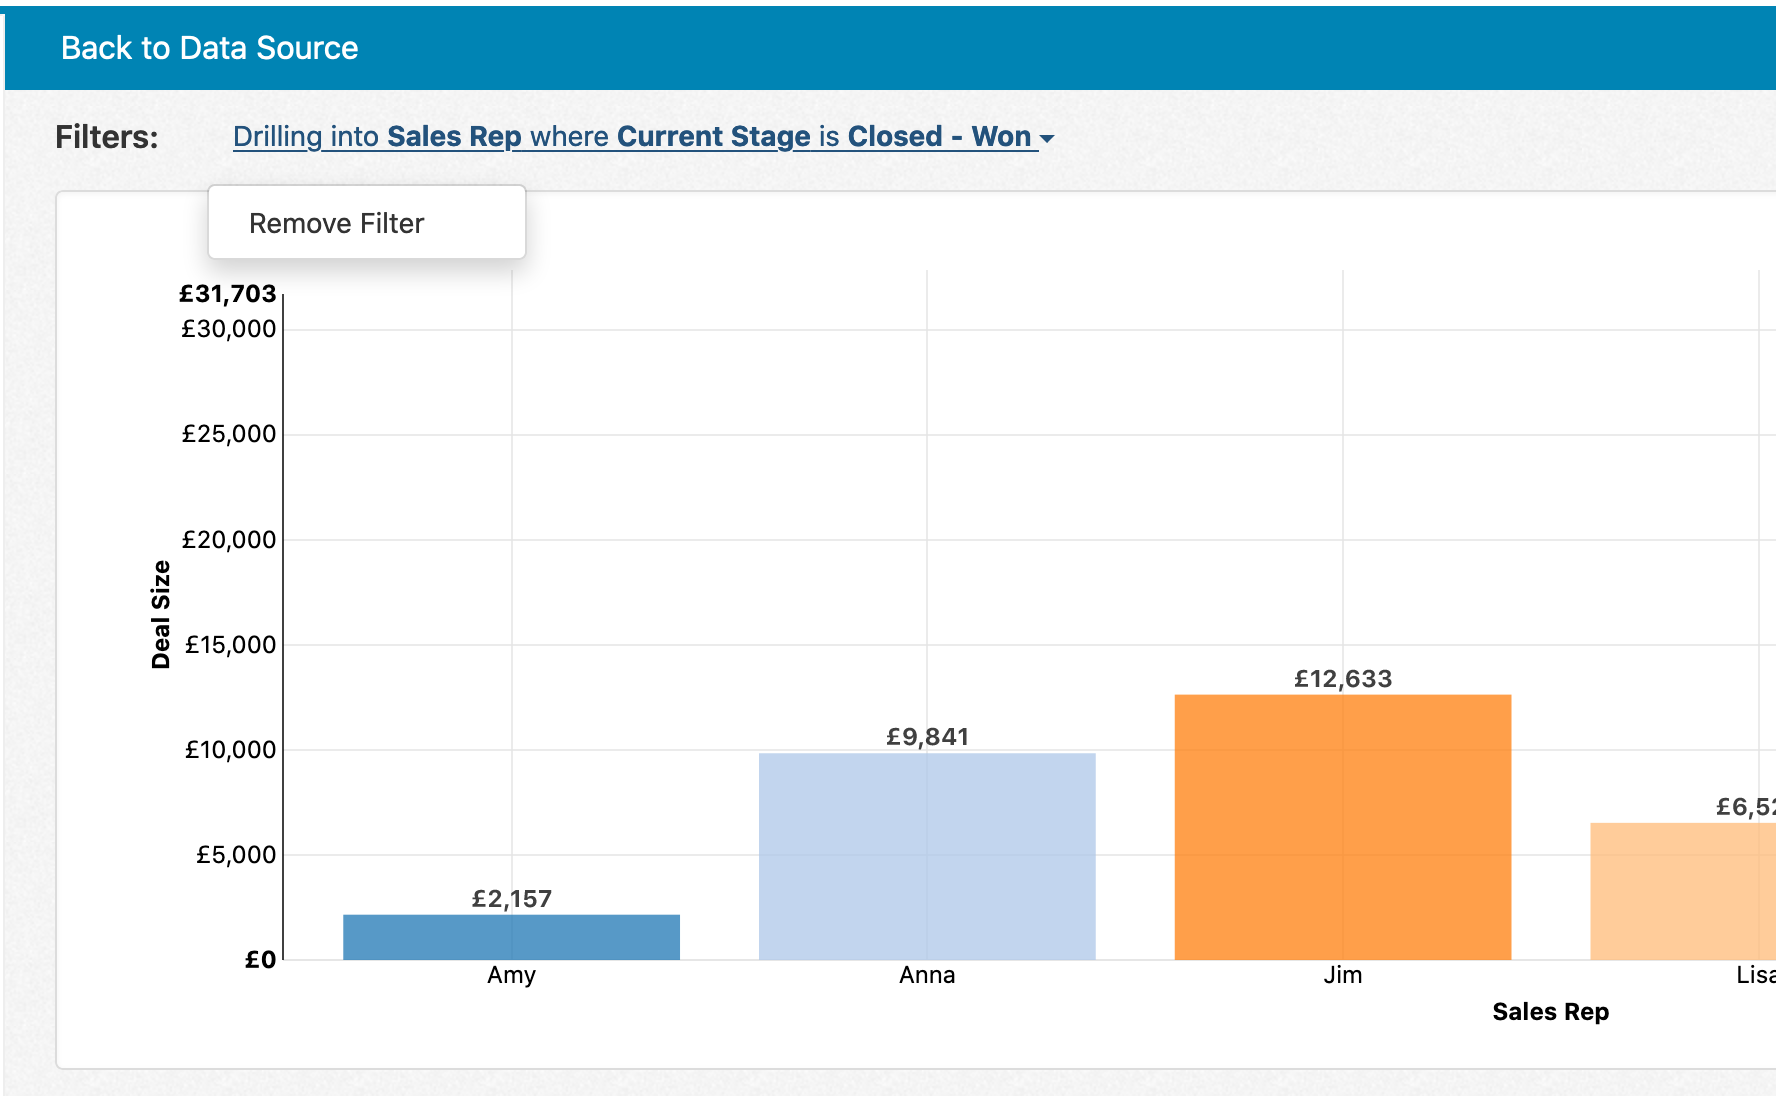
Once you've drilled into a particular value, you can remove it by clicking on the filter and choosing Remove: