You can use goals in Easy Insight to help define targets in a variety of ways:
You can set a single goal for your sales, you can set a goal per rep, brand, or any other grouping, or you can set a more complicated goal for each rep/SKU, each rep/customer, or for anything else you may want to define.
To get started, click on the Goals section of your data source and click on 'Add Goals' to add a new set of goals:
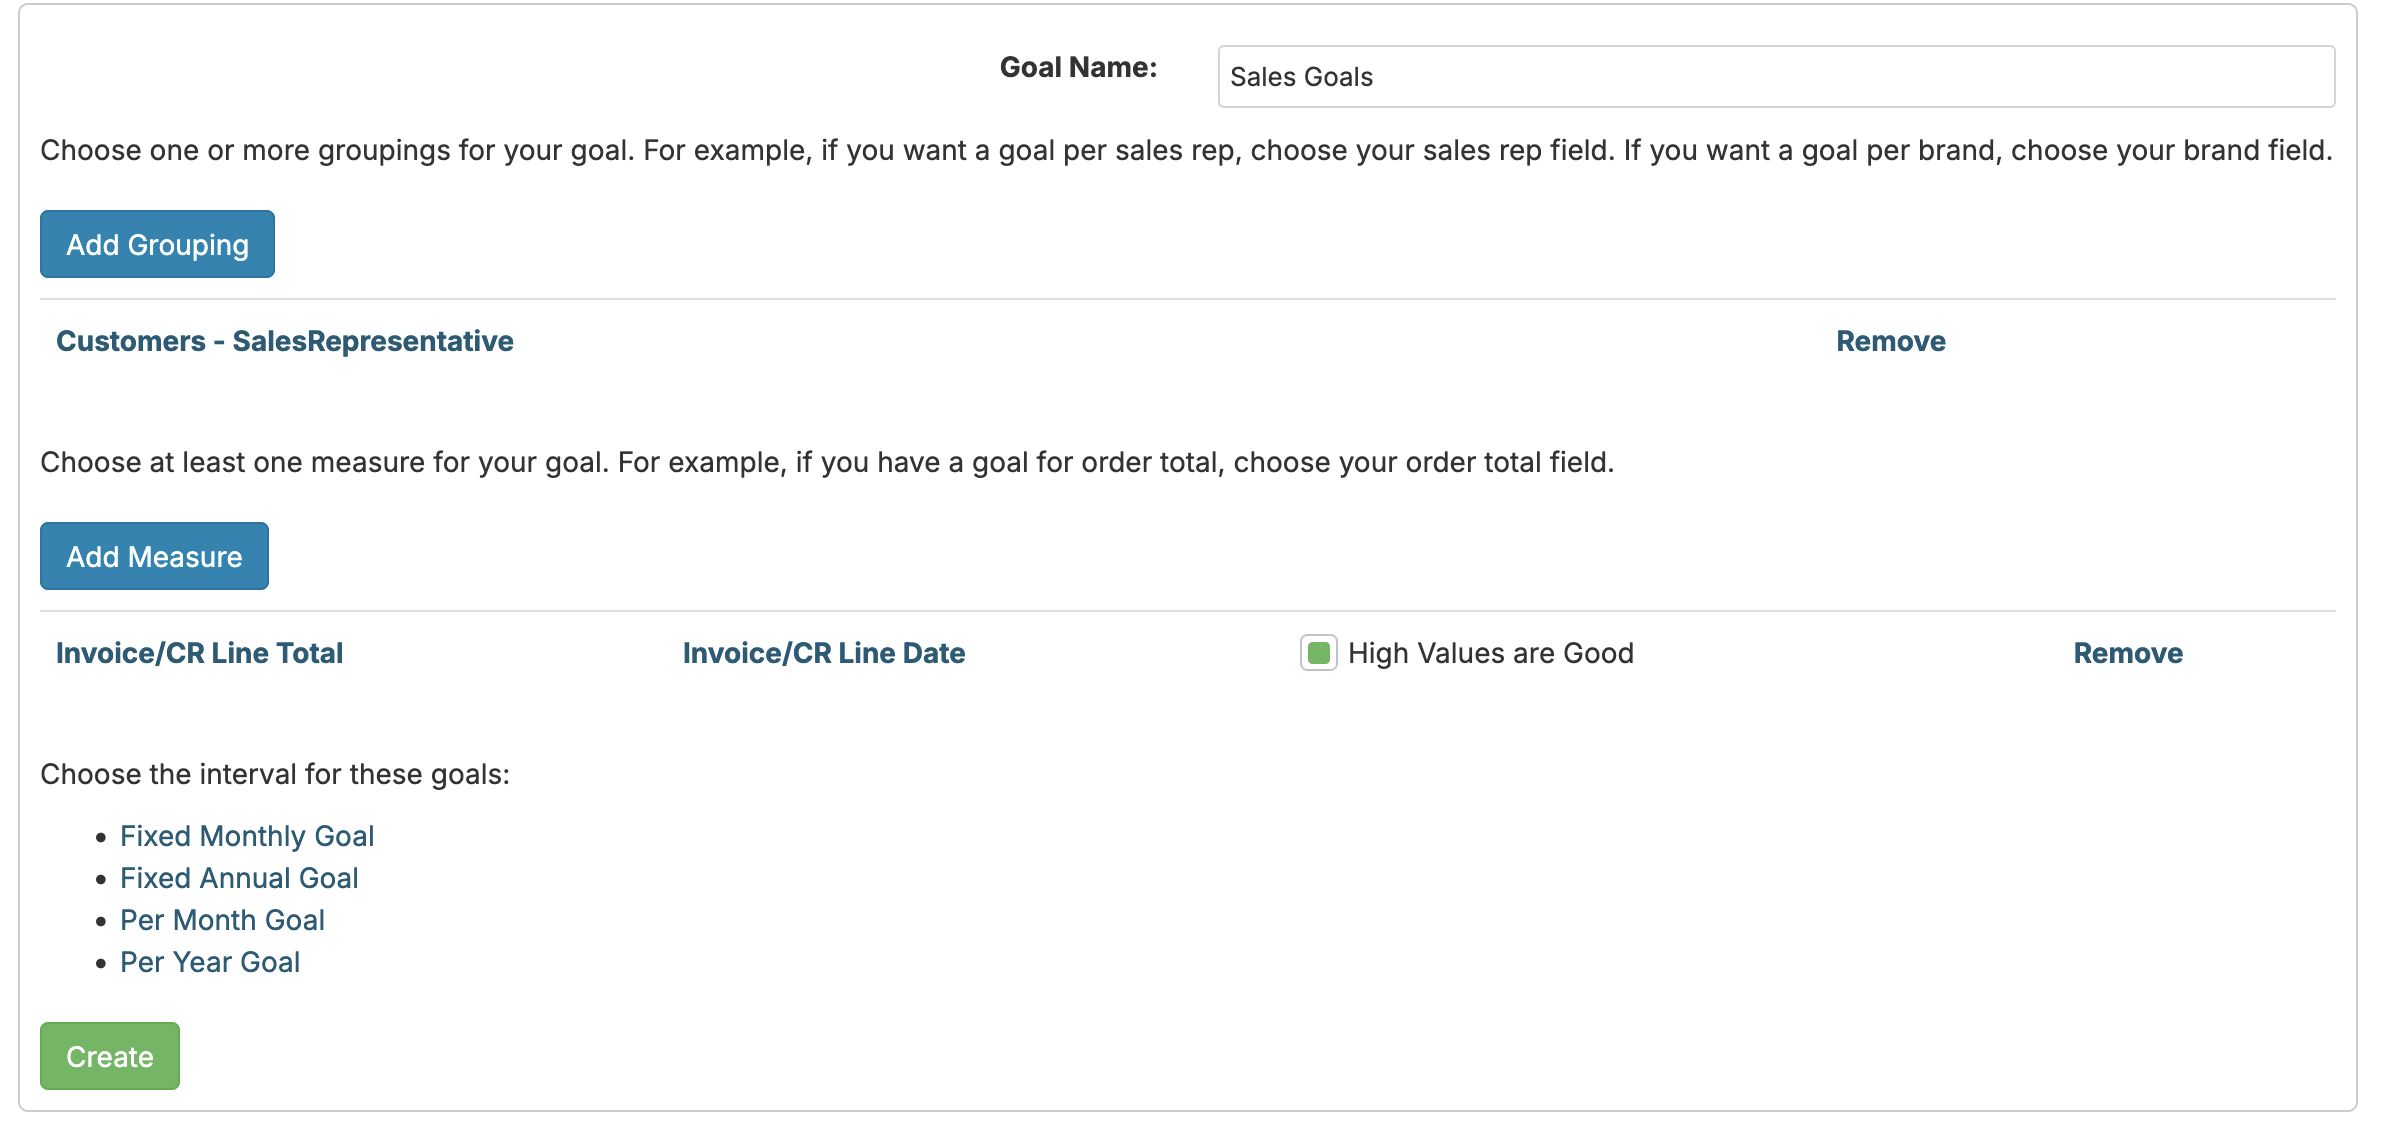
You'll need to give your goals a name, optionally choose one or more groupings, choose at least one measure, and choose the interval for the goals.
Examples of groupings you might use for your goals include:
Your data source may have multiple suggested groupings for you to help simplify the process.
You don't have to configure any groupings if your goal is going to be for a metric across your entire data set. You can do a single grouping, or if necessary, you can do multiple groupings. For example, if you have a goal per rep and brand, you would include both rep and brand as fields.
You'll need to choose at least one measure. When you go to choose a measure, you'll be prompted to choose a data source field or a KPI. Data source fields are fields defined within the data source itself, while KPIs are custom calculations defined within a report. Examples of data source fields include:
Your data source may have multiple suggested goal fields for you to help simplify the process:
Examples of KPIs that you'll pull from a report include:
The KPIs shown will come from all reports saved with the 'KPI Report' setting found under Configuration -> Report Properties. By default, the Monthly Metrics report for each connection is saved with the KPI Report flag.
If the measure is a data source field, you'll need to choose the date field for the goal. For example, you might choose Order Date, Invoice Date, or Ship Date for your order metrics, Task Completed Date for task metrics, or Ticket Resolved At for support metrics.
You'll also need to choose whether or not a high value is good for the metric. High values would be good for sales and profit, but bad for return rate or stockout rate.
Finally, you need to choose the interval. There are four options:
After you create your goals, an auto generated dashboard will provide a set of template reports using your defined goals. You can take these reports, modify them to your needs, and add them to other existing dashboards:
After your setup, the screen should look something like this:
You can return to your goal configuration from the data source page under the Goals section. Click on the Goal name to go to your configuration for the goal:
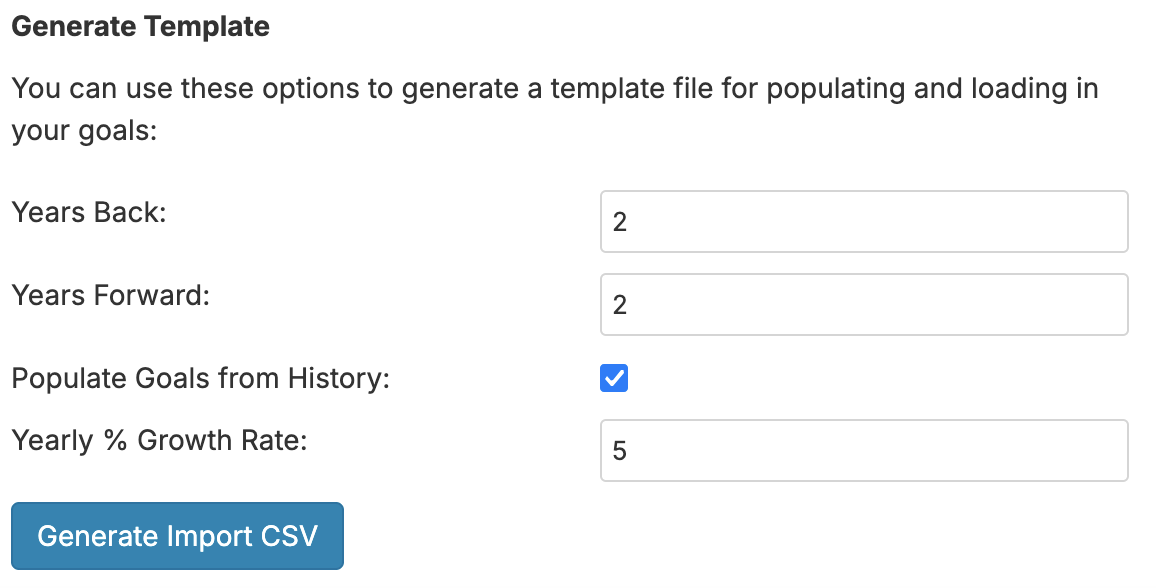
You can add additional metrics to your goal here. You can also download a template for use in uploading goal values.
With this template, you can choose whether or not to prepopulate the template based on historical data. You can choose the number of months or years backward and forward for your template:
After populating the template, you can add the goal data by clicking on Import New Goal Data:
The new goal data will automatically flow through into the template reports:
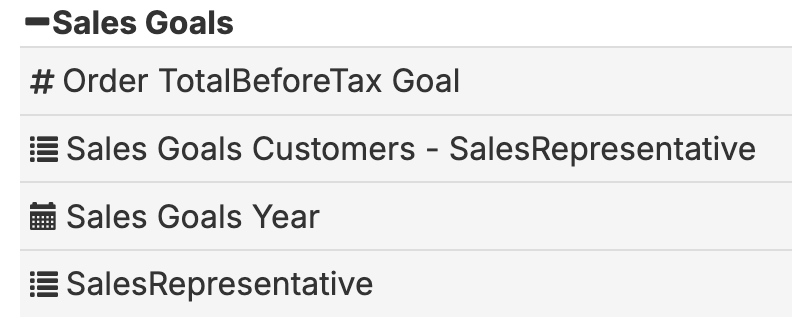
You can use the goal data like any other field data in your reports. The goal fields are found under the (your goal name) Goals folder:
You can also automatically apply goals to certain report types by going to Configuration -> Report Properties and checking the Automatically Apply Goals option:
For Column and Trend Charts, the column bars will automatically highlight in green or yellow and a trend line will be shown on the chart:
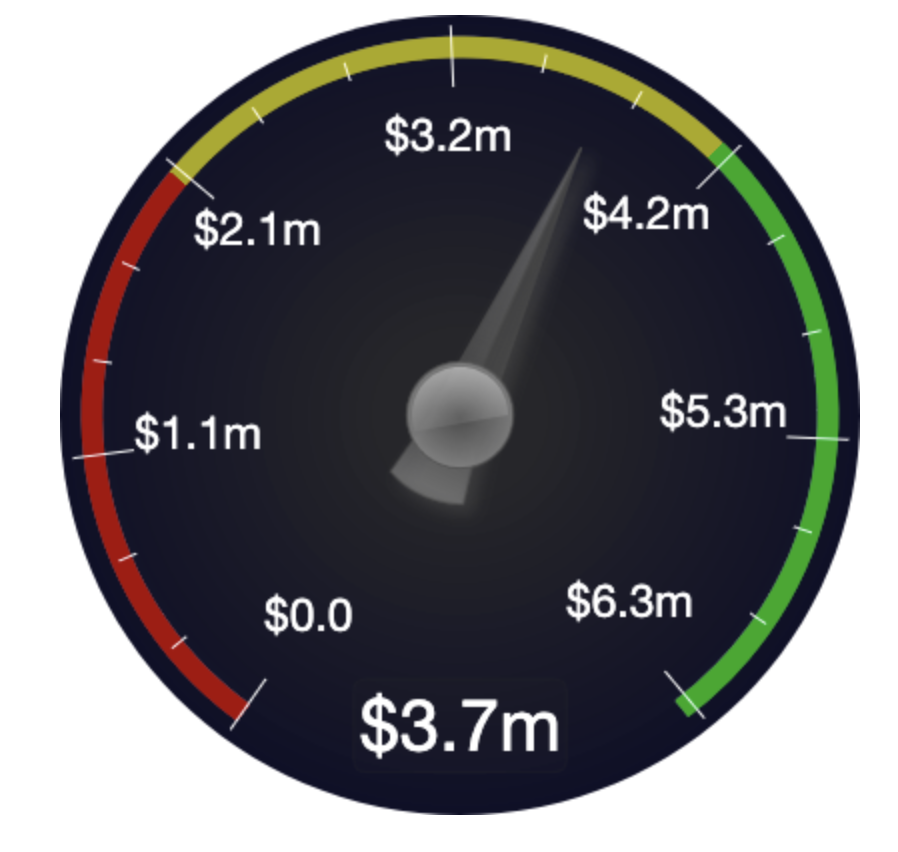
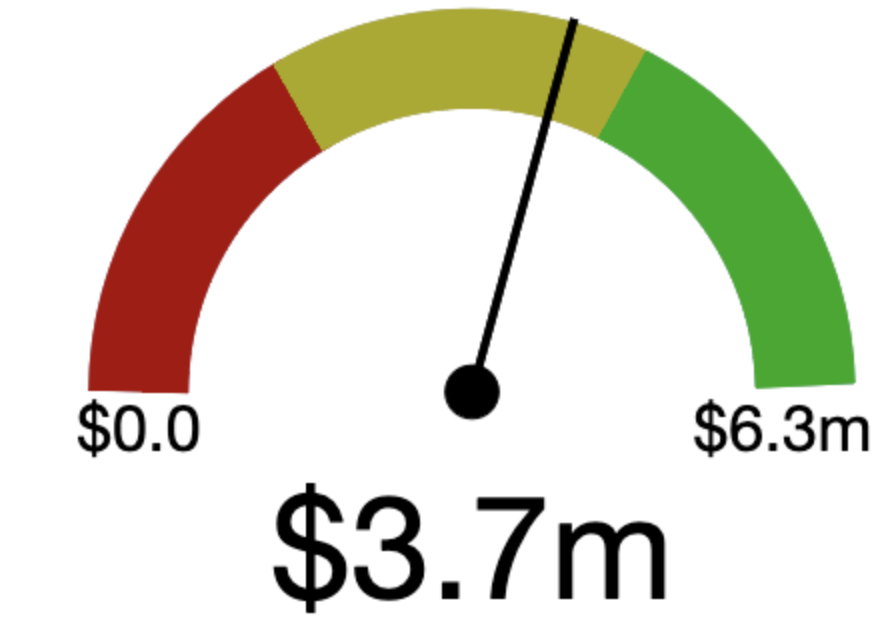
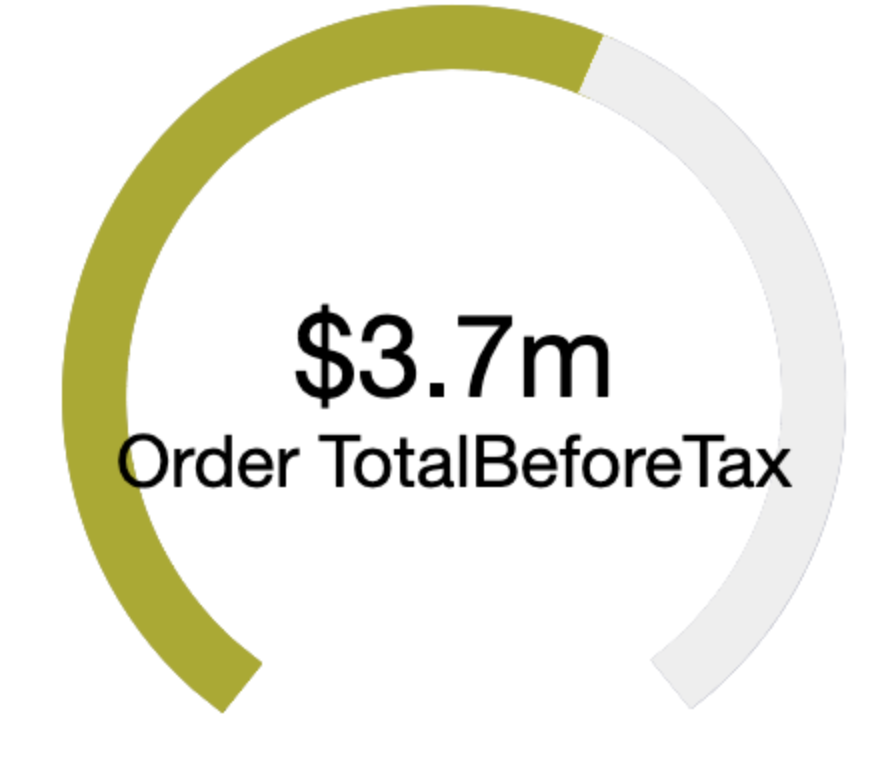
For Gauges and Bullet Charts, the max value and alert point highlighting will be automatically based on the goal:
For Month over Month charts, cells on the tables will be highlighted based on the goal per measure: