Are you getting a new Katana implementation up and going? You can use Easy Insight to help! There are three main things you can do to help your new implementation succeed:
Katana has a number of CSV templates you can use to import initial data from customers, suppliers, products, BOMs, and more. You can use Easy Insight to help map your existing data into these templates. The supported templates include the following:
First, you'll need to create the connection to your Katana account through the Connections page in Easy Insight. When creating your connection to Katana, make sure to check the 'Are you migrating data off of another platform onto Katana?' option:
You'll also want to create the 'Inventory Import' connection through the Connections page:
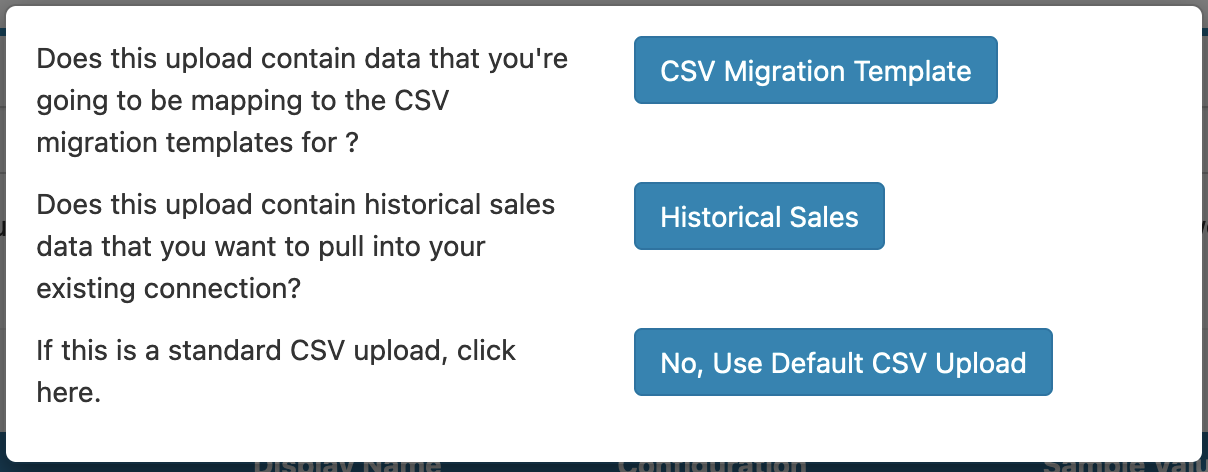
After you have that connection created, you'll want to go to the Excel/CSV connection and upload your existing CSV file. If you have the connections to Katana and the Inventory Import connection created, it will give you the option of 'Does this upload contain data that you're going to be mapping to the CSV migration templates?':
Go ahead and select this option, then look through the list of fields in the upload to make sure they have the right type selected. If the field is any sort of text field, you'll want to make sure it's a Grouping. For example, double check that phone numbers, zip codes, order numbers, and SKUs are all coming through appropriately as Groupings, not Measures. Once you're verified everything, click Create Data Source.
After Easy Insight finishes processing your data, the CSV or Excel data source you just created will automatically be added to your Inventory Import data source and you'll be redirected to the Integrations page in Easy Insight. If nothing shows up in the list, click on 'Generate Integration Templates' to create the template mappings for the import files:
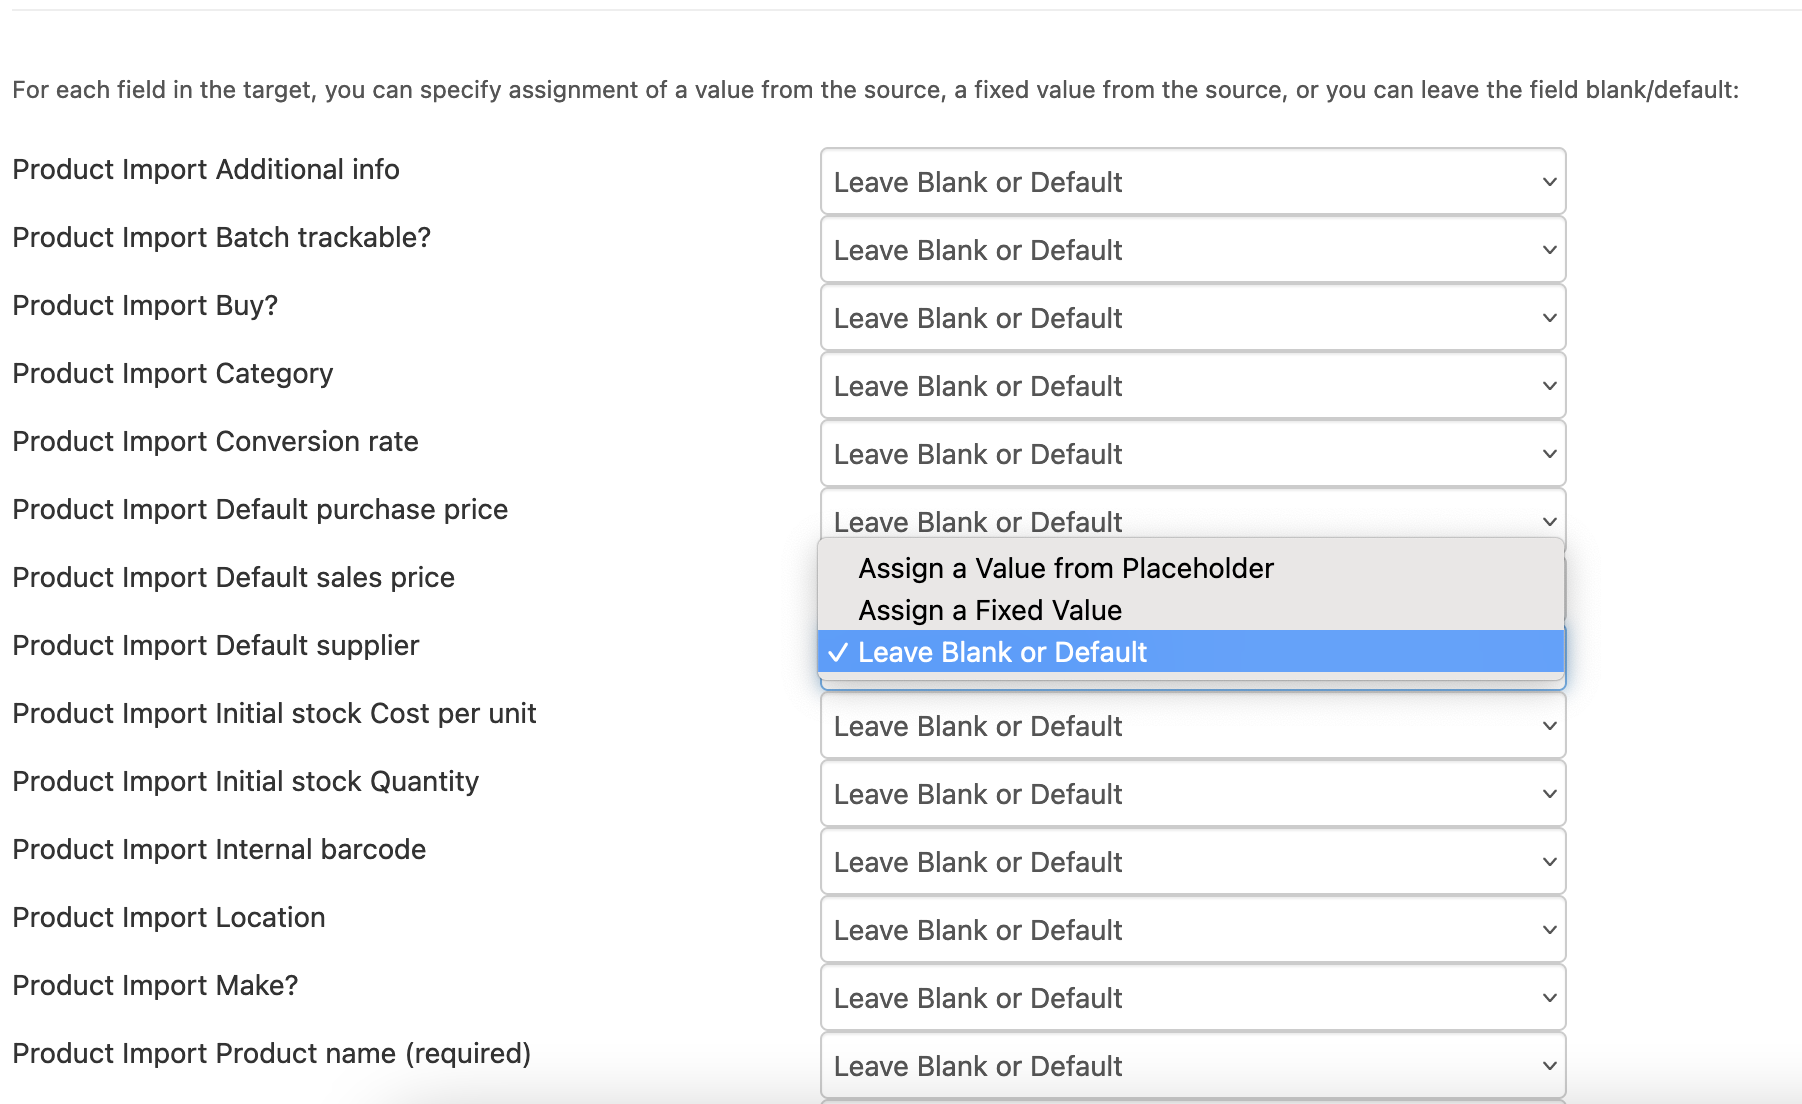
Once you have your integration templates, you can go into each and map the fields accordingly. For example, for the product integration, you would map the SKU, name, description, price, and anything else that you have in your CSV data. Depending on the integration, it will either directly push the data into Katana via the API or generate a CSV file that you can import into Katana.
If the CSV file is larger than the Katana import limit, the generated file will instead be a ZIP file containing multiple CSVs that you can then import into Katana.
Once you complete importing a particular step of data into Katana, you can check the integration off as Completed through the interface in Easy Insight to help track what you've done.
Given the difficulty of importing sales history into Katana, you can use Easy Insight as a repository for your historical sales data, then create reports that combine that historical sales data with your ongoing Katana data.
First, you'll need to have your connection to Katana created. Next, go to the Excel/CSV Connection. If you have the connection to Katana installed, you'll be given a prompt with the option of 'Does this upload contain historical sales data that you want to pull into your existing Katana Systems connection?':
Go ahead and select this option, then look through the list of fields in the upload to make sure they have the right type selected. If the field is any sort of text field, you'll want to make sure it's a Grouping. For example, double check that phone numbers, zip codes, order numbers, and SKUs are all coming through appropriately as Groupings, not Measures. Once you're verified everything, click Create Data Source.
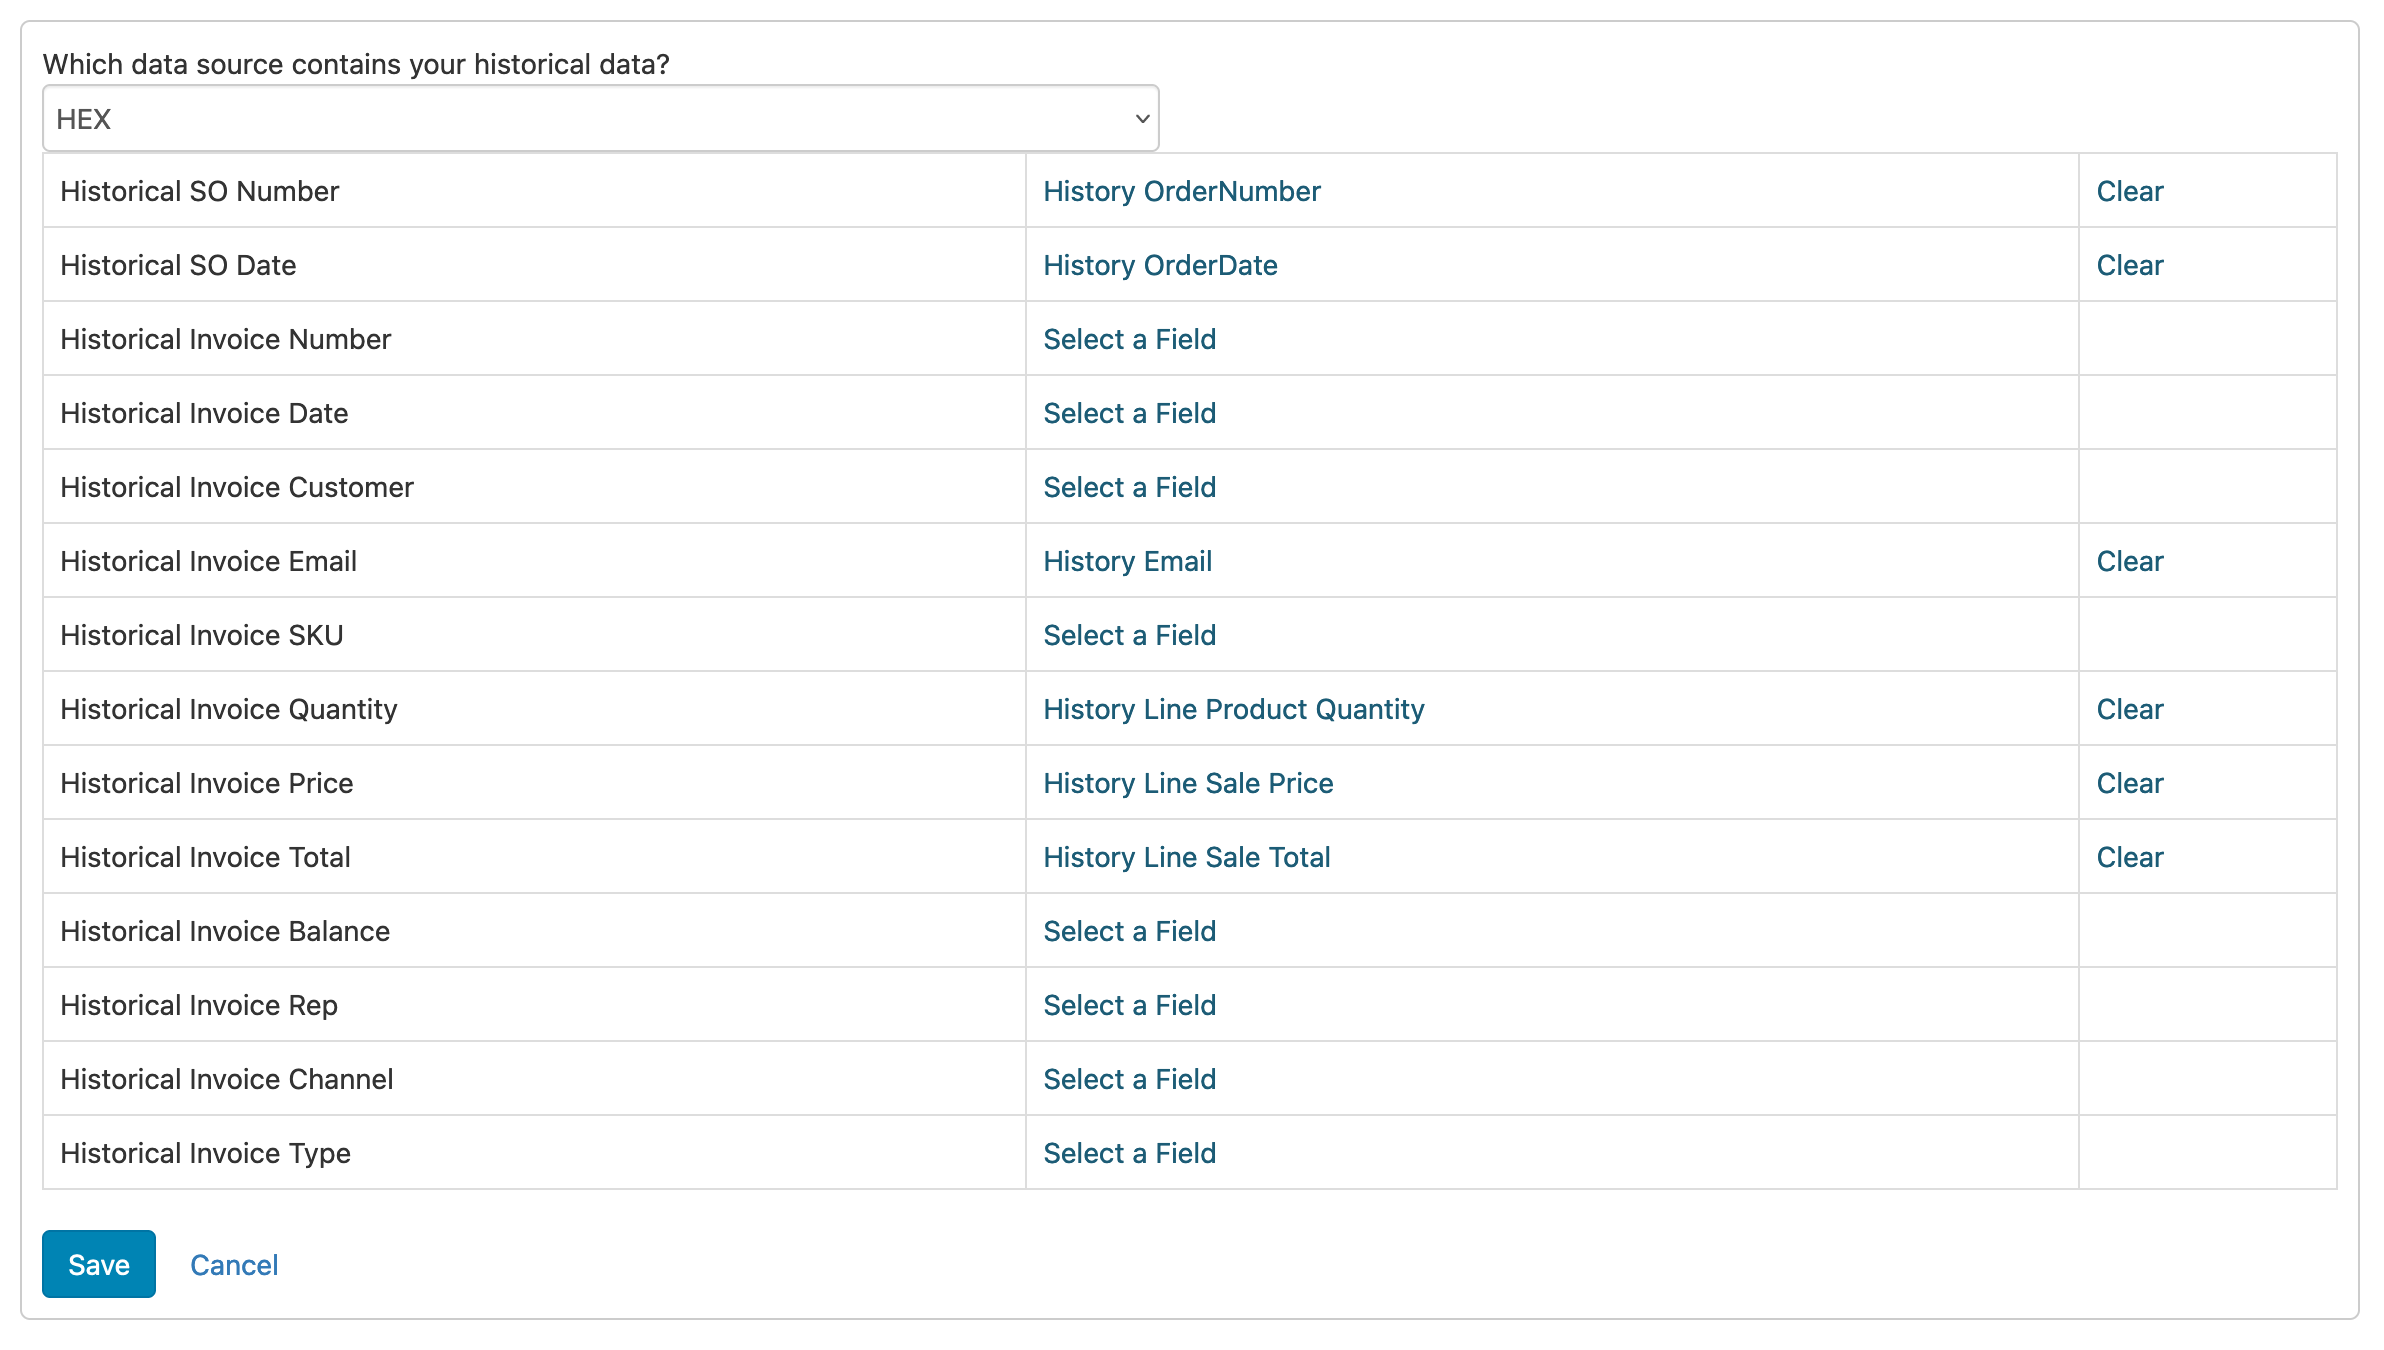
After Easy Insight finishes processing your data, you'll be redirected to the Historical Data Setup page for your Katana systems data source. Go through and choose the mapping of fields from your Excel/CSV data. For historical sales data, the followings mapping exists:
You only have to map the fields that exist in your data. For example, if you have only have an Order Number and not an Invoice Number, Easy Insight will automatically default to using Order Number.
Once you've finished mapping fields, go ahead and save. It'll take a couple of minutes for Easy Insight to internally update caches. Once caches are updated, you can view your prebuilt dashboard or other reports again. In particular, the Product Analysis report for inventory forecasting will be updated to include the history from the sales side so that your replenishment planning can have an accurate view on daily or monthly demand and remaining days of stock. The Customer reports are updated to have accurate lifetime customer value and to list all orders for the customer across historical and Katana data. If you're using dashboard links, the dashboard link showing that customer's data will automatically updated so that your sales team can click from their CRM into the full list of orders.
If you need to make advanced tweaks to the data, you can edit the Historical Invoices report under Calculation Reports to add any additional appropriate handling to the data.
If you're setting up a new Katana in a situation where you maybe didn't have an inventory system previously, but do have existing data on Shopify, Amazon, and other systems, you can use Easy Insight to load in the data from those e-commerce channels to help you do trend analysis, forecasting, and other reports right out of the gate.
First, you'll want to connect your e-commerce channels to Easy Insight. We currently support the following e-commerce integrations:
If you have multiple stores, you'll want to make sure each data source is uniquely named before you proceed. Shopify connections automatically include the store name as part of their data source name, but for other channels, you'll want to rename to Amazon - Store1, Amazon - Store 2, and so on.
Once you have your e-commerce connections created and once you have your new Katana connection set up, go to the data source page for your Katana connection. Click on the Inventory tab and click on E-Commerce History:
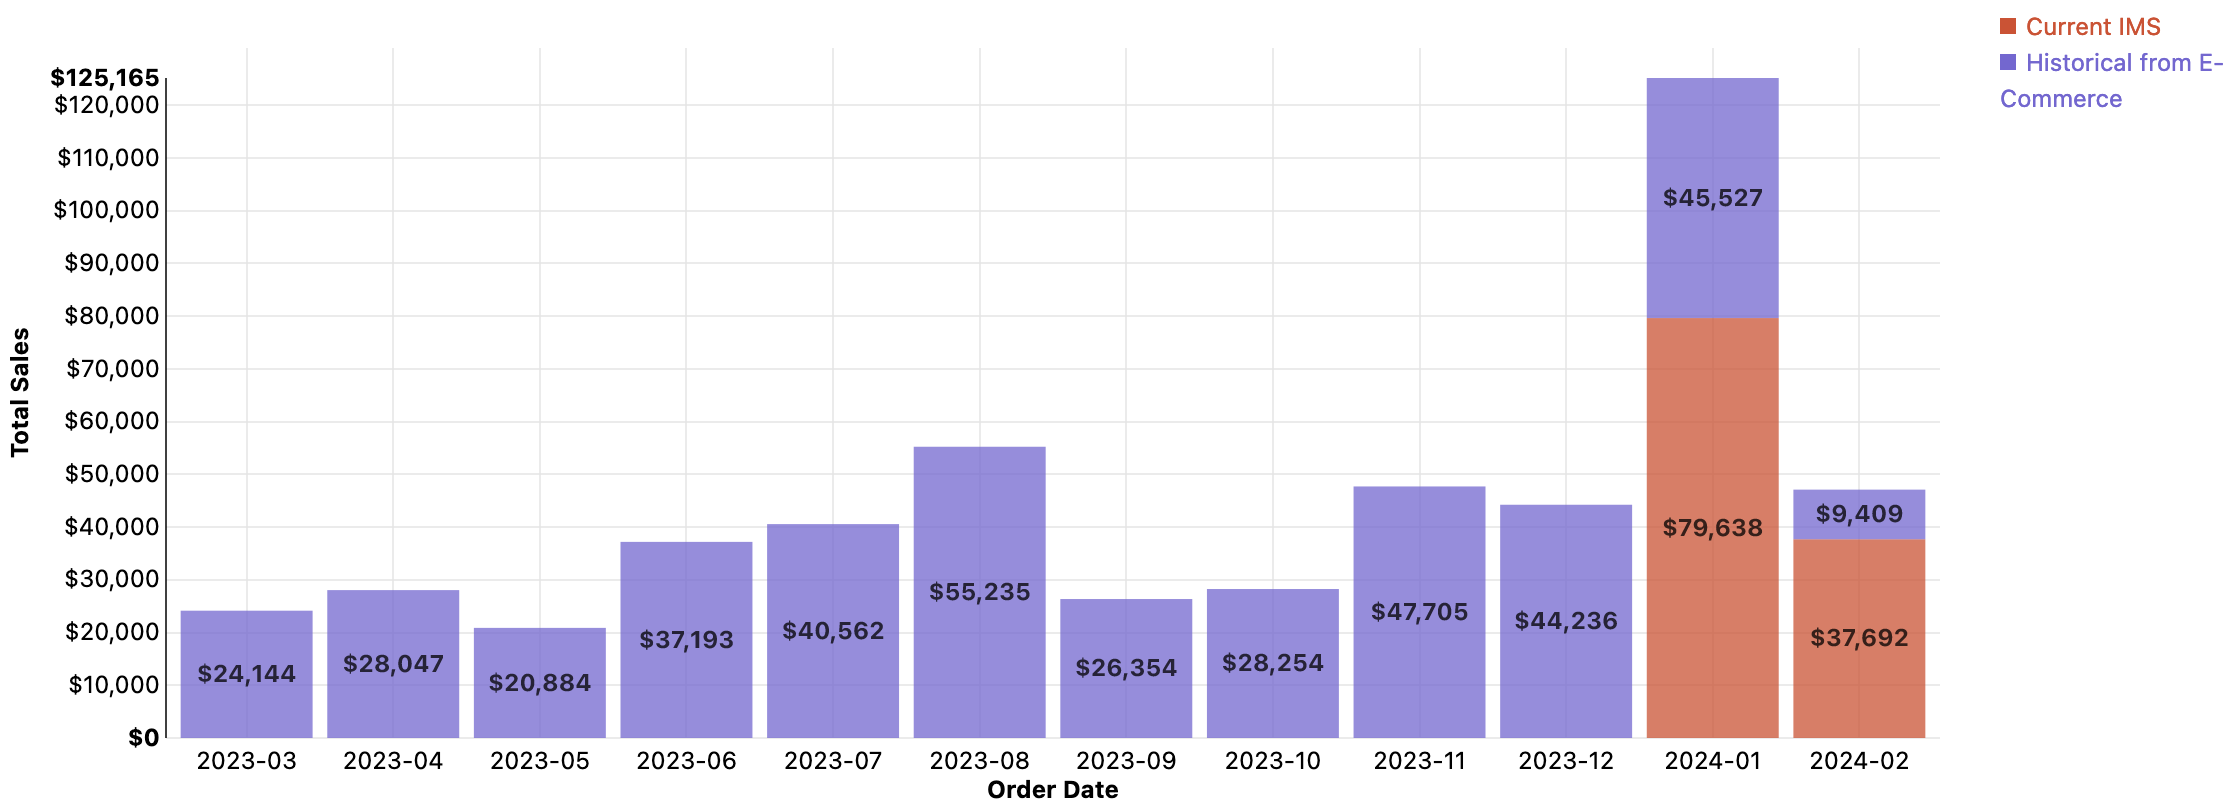
You'll see the list of connected channels. Click on 'Add Historical Channel Sales' to connect the history: It'll take a bit, but after it finishes, it'll pull that history through. After pulling through this history, you'll see it come through into your Katana dashboards and reports. For example, looking at Trends:
It'll take a bit, but after it finishes, it'll pull that history through. After pulling through this history, you'll see it come through into your Katana dashboards and reports. For example, looking at Trends:
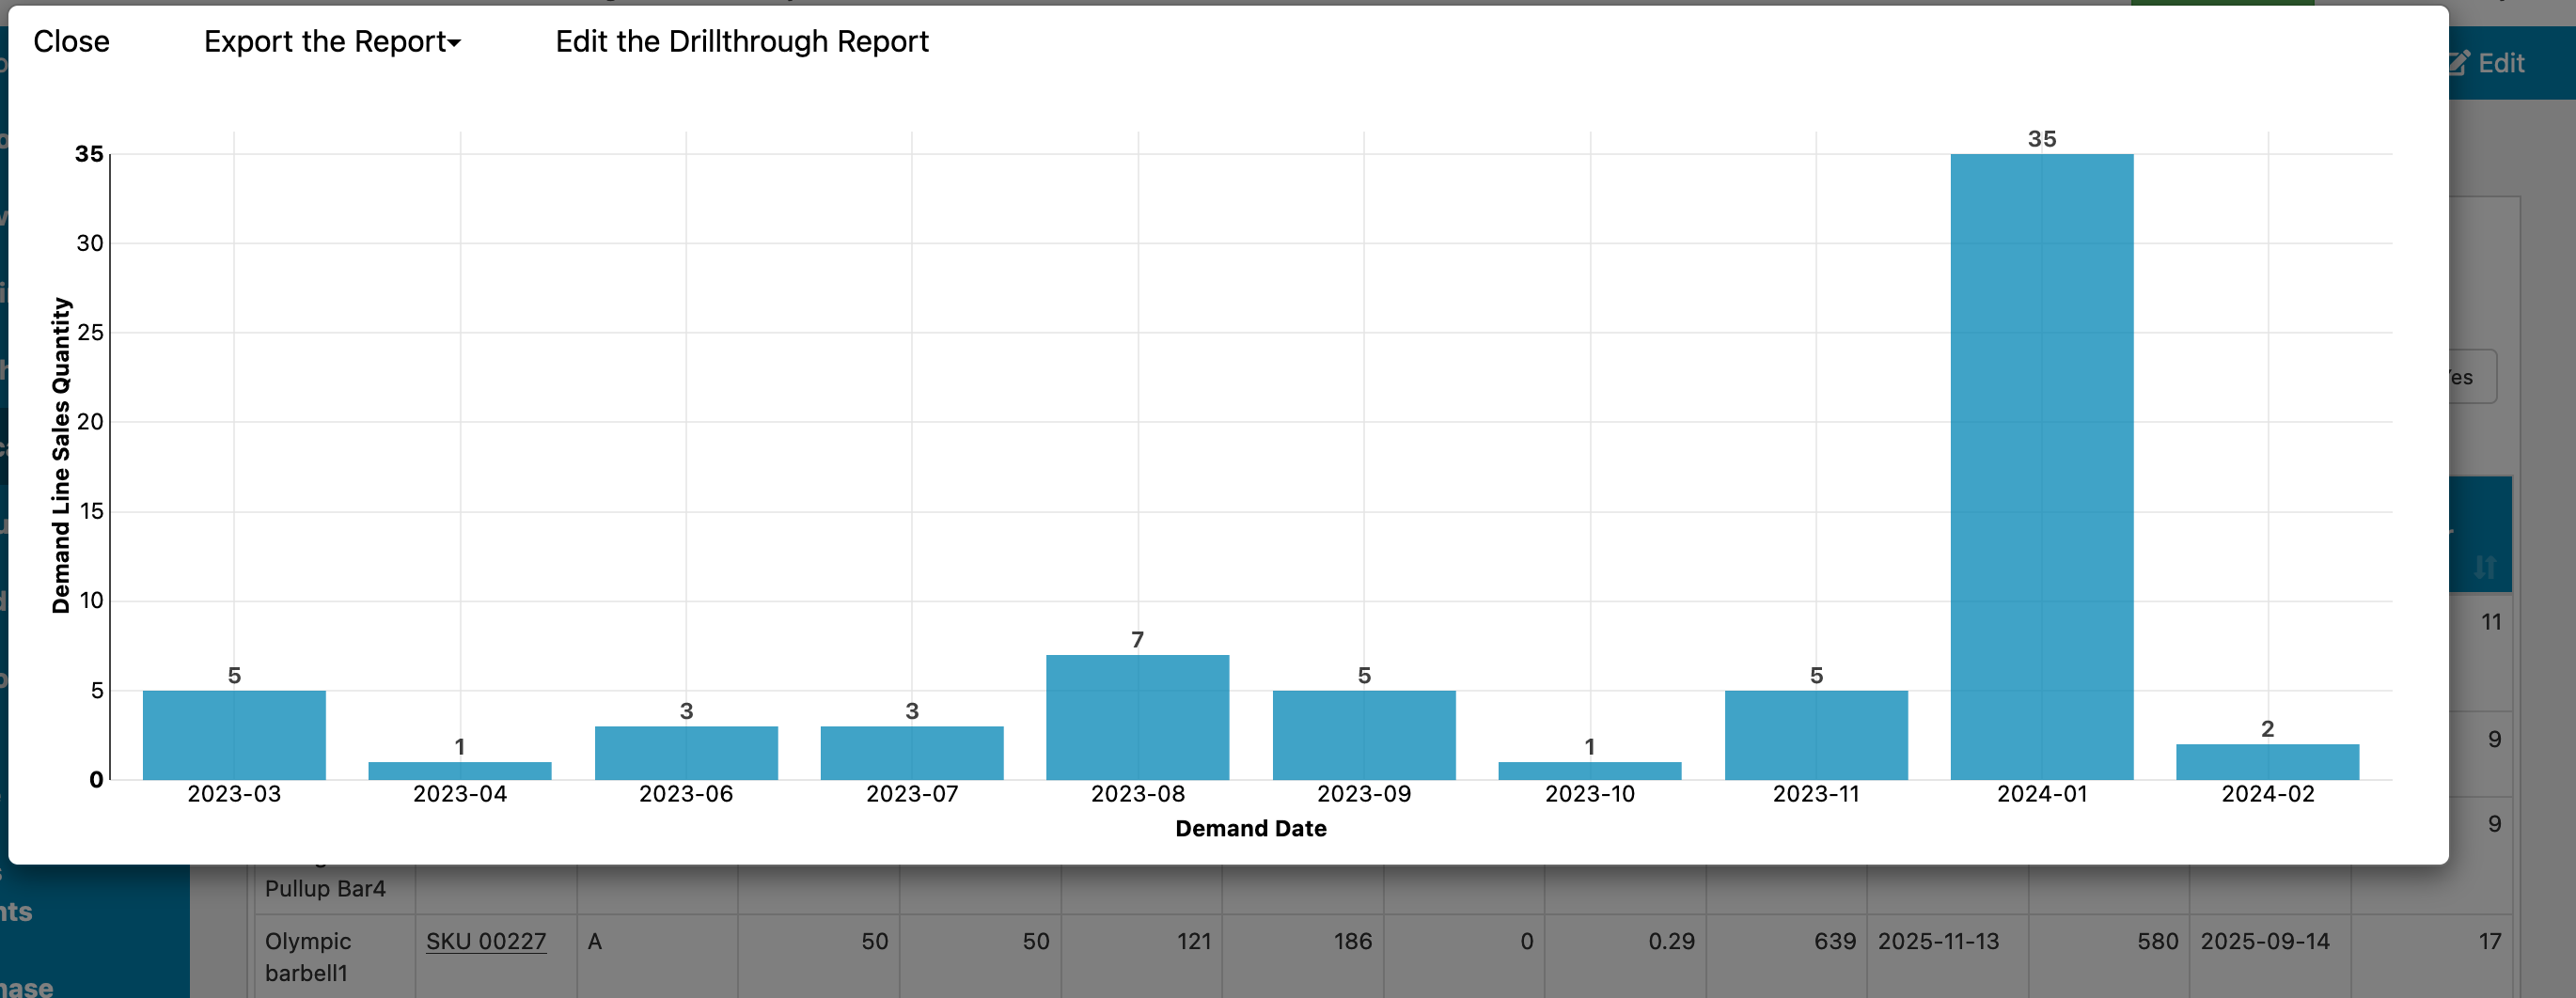
Or looking at forecasting:
By default, it sets a history cutoff date of today on the report feeding this through data so that it won't duplicate data. If you need to change this date, you can go to the eCommerce Sales History report under the eCommerce History data source. By default, this data source is hidden, so you'll need to click on Options on the data source list and choose 'Show All Data Sources'. From the report, change the date filter there on eCommerce Order Date: