Easy Insight Logo
Call 1-(720)-316-8174

Building Custom Reports in Katana

This section provides specific tips and tricks around building reports on your Katana data. You can find our general guidance on building your own reports under Report Basics.

Easy Insight pulls over all of Katana's data so when you're creating your own report, it can be a little overwhelming when you do Choose Field:

Setup Field Edit

Since the Katana connection has a large number of folder and fields, it can be helpful to use the tag toggles when choosing a field. For example, if you click on Sales:

Setup Field Edit

The Sales tag contains various sales related data, the Manufacturing tag contains your manufacturing operation data, the Purchasing tag contains your purchase order data, and the Stock tag contains your inventory, stock adjustment, and stock transfer data.

Here are some of the most useful folders to be aware of:

  • COGS fields contains calculated values for COGS, gross profit, and net profit.
  • Customers contains information about your customers. The most common fields we see used from this folder include Name, Email, and Phone.
  • Fulfillments splits out your sales fulfillment data such as picked date, tracking carrier, and status.
  • Inventory contains your stock level information per location, including available, expected, and committed.
  • Manufacturing Orders contains your manufacturing order data such as material, operations, and subassembly costs.
  • Manufacturing Order Operations contains manufacturing operation data such as operation name, operation planned and actual costs, and operation planned and actual times.
  • Manufacturing Order Assigned Operator contains your operator data for identifying resource allocation.
  • Products contains your product data such as category and product name.
  • Purchase Orders contains your purchase order such as purchase number, expected arrival date, and billing status.
  • Purchase Order Rows contains the specific line level for your purchase order including the link to the variant, quantity, and received date.
  • SaleOrders contains your sales orders including order number, order date, source, and linked ecommerce information.
  • Sales Order Lines contains your sales order lines, including quantity, SKU, and line total in base currency.
  • Variants contains your product variants, including SKU and all variant custom fields.

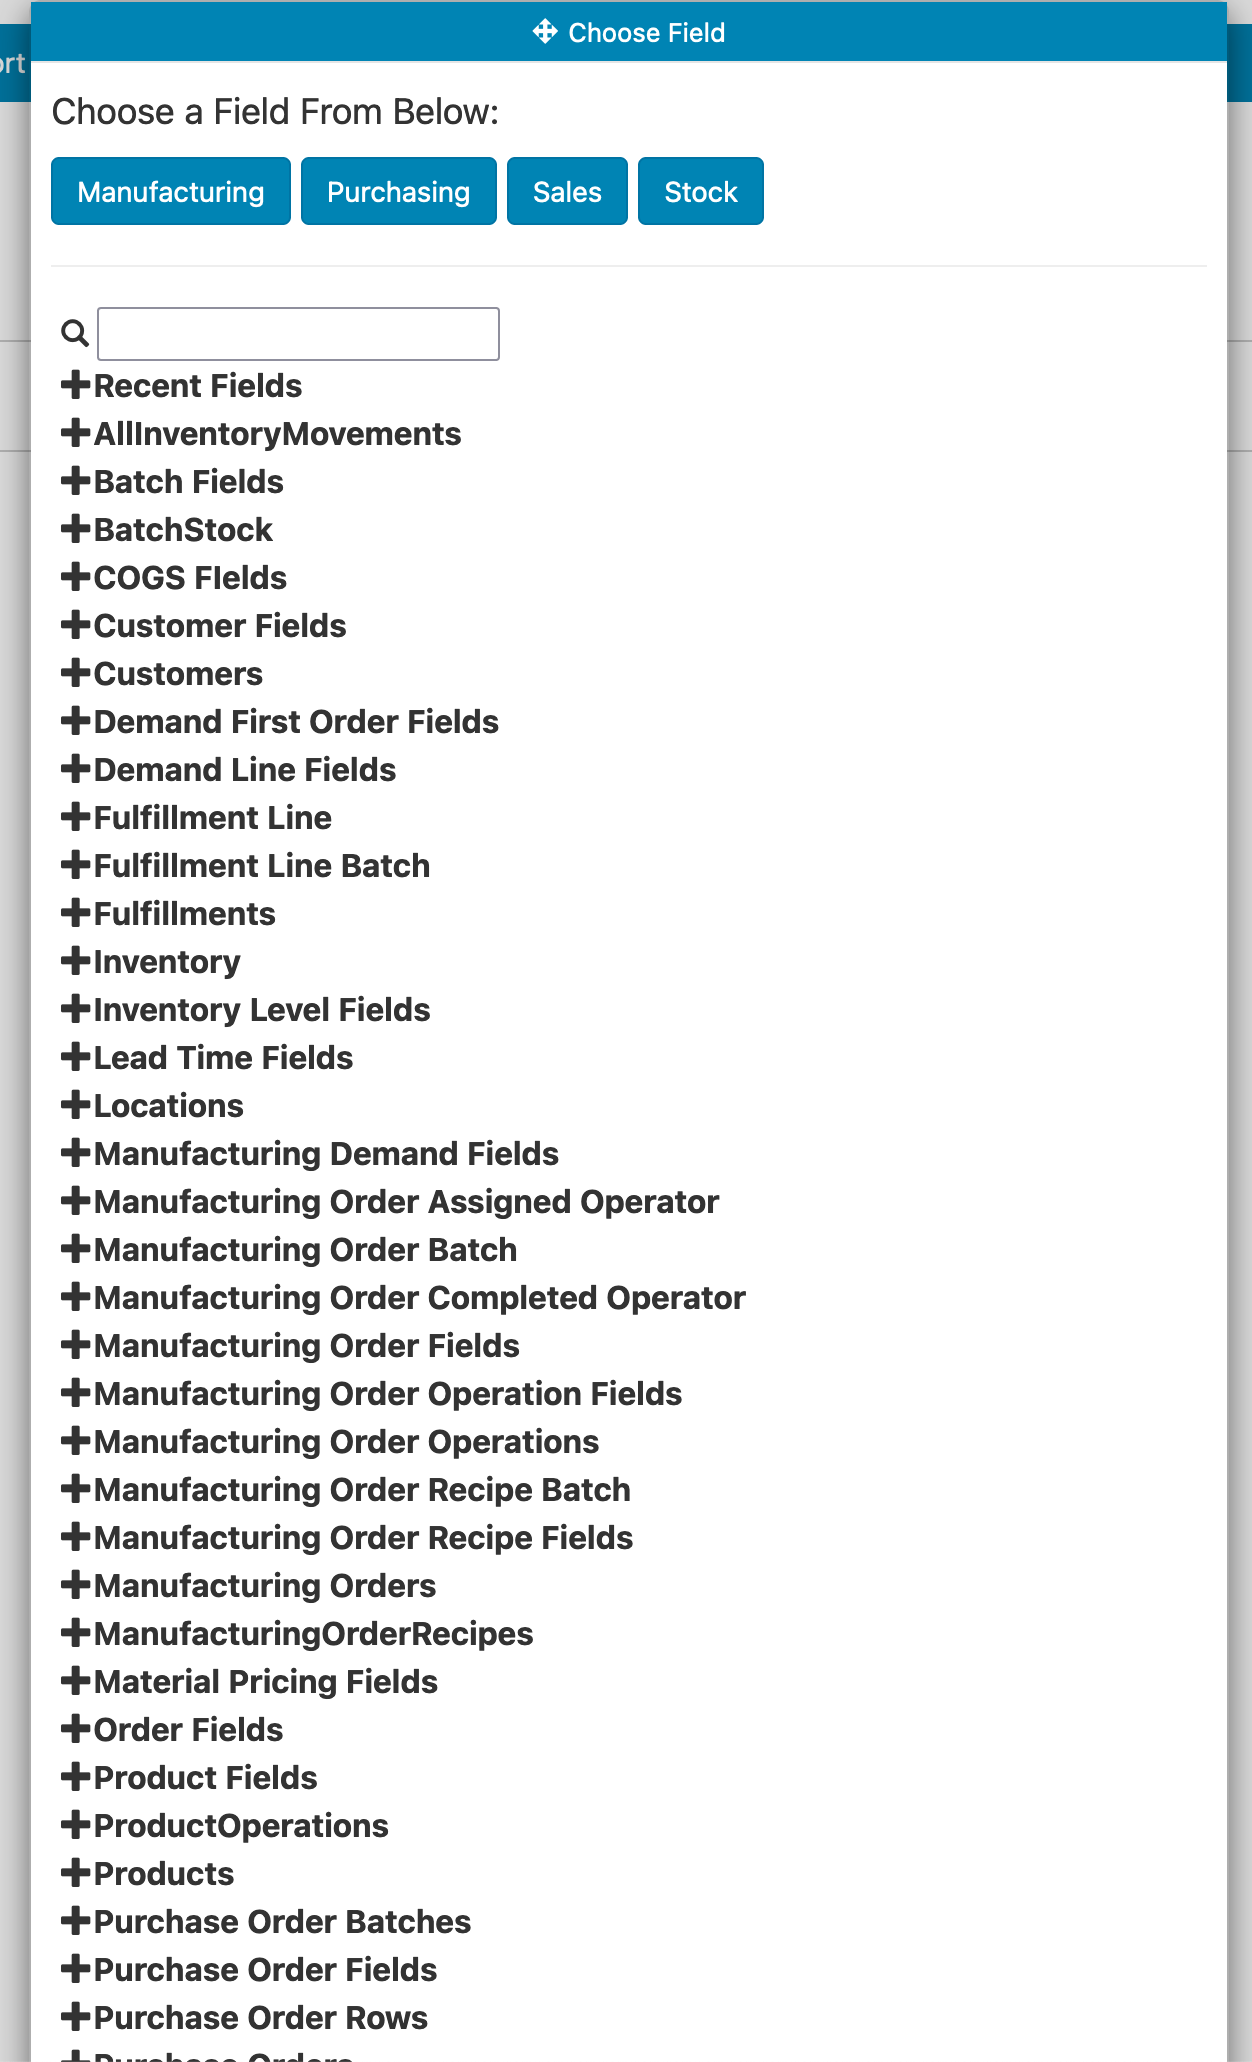
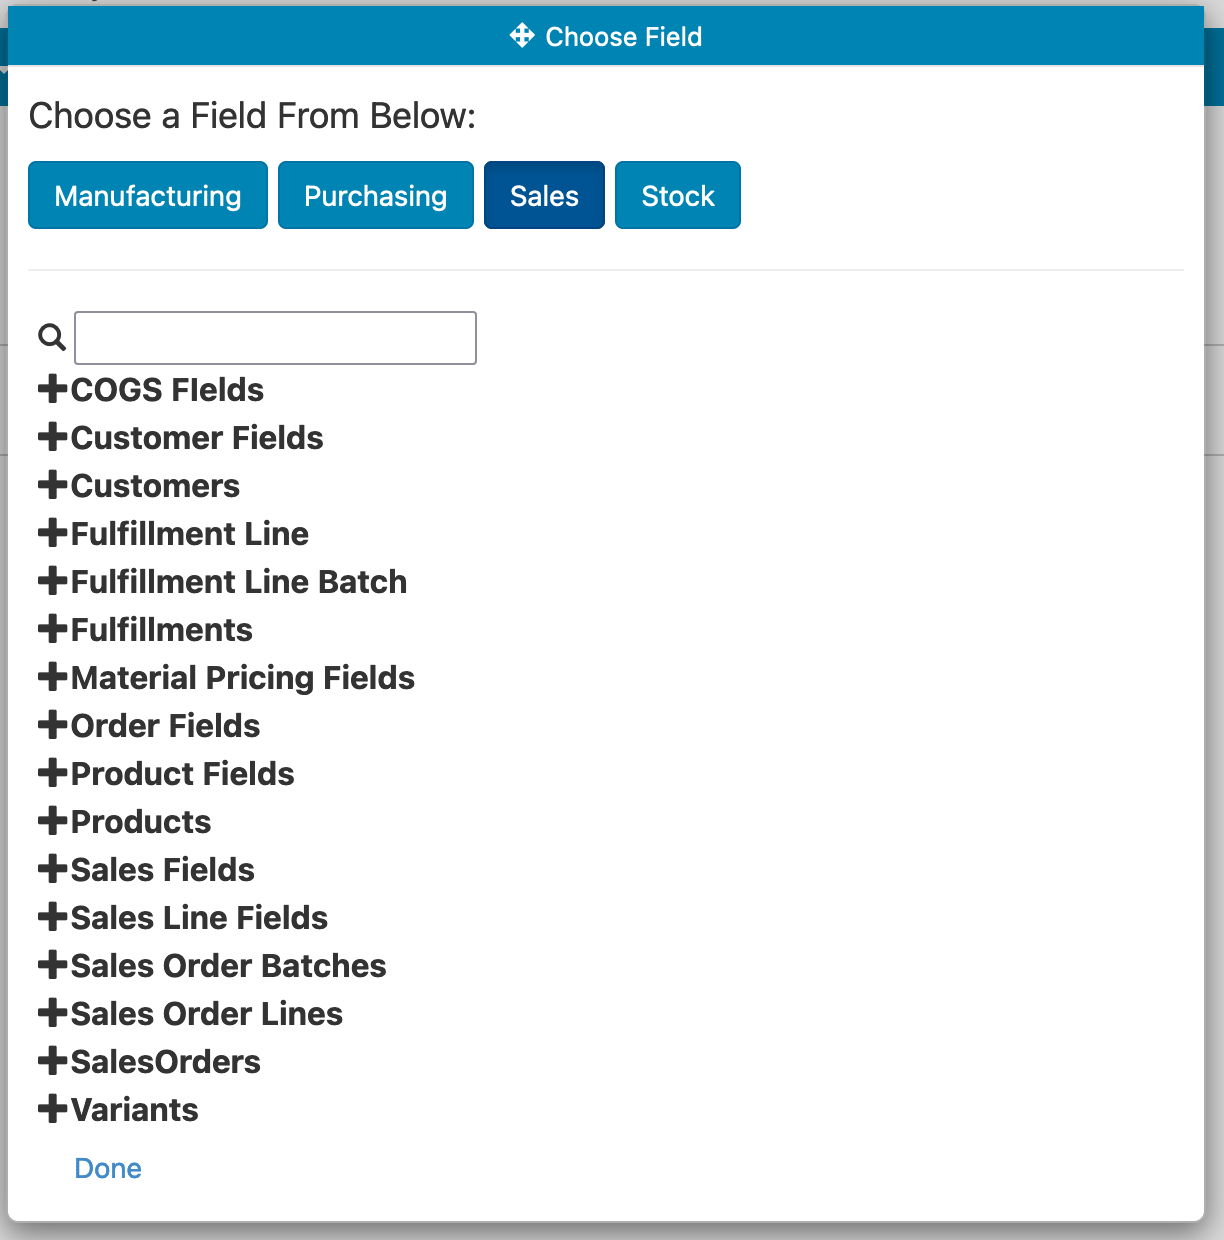
When building reports, you can add fields from different folders and Easy Insight will automatically connect the data. For example, you might add Customers -> Name, Product -> Category, and Sales Order Lines -> Line Total in Base Currency to show the sales total by customer and product category. Note that you'll want to use Line Total in Base Currency in order to factor in any multi currencies and to report at the line leve, not the order level. If you used Sales Order -> Total in Base Currency, it might give inaccurate data since it would be reporting the sales order total, not the line total specific to a product category.

As a further example, if you want to set up a table of product name, SKU, total sales, gross profit, available quantity, and on order quantity filtered by product category and order date, you would do the following:

  • First, Choose Field and select Products -> Name.
  • Choose field again and select Variants -> SKU.
  • Choose field again and select Sales Order Lines -> Line Total in Base Currency.
  • Choose field again and select COGS Fields -> Gross Profit.
  • Choose field again and select Inventory -> Quantity in Stock.
  • Choose field again and select Inventory -> Quantity Expected.
  • Click on Create Filter, choose Products -> Category Name, and choose Multi Value to have a list of tags you can select from.
  • Click on Create Filter, choose SalesOrders -> Order Created Date, choose Absolute, then choose the date range you want to filter on.

If you want to adjust a particular field, you can click on the green field dropdown and do Edit the Field to adjust properties. For example, you could change Line Total in Base Currency to include cents in the display by changing the Maximum and Minimum decimal points in the field editor.

You can save your report with the Save button in the upper left of the report editor. Once saved, the report will appear in the report list under your Katana data source.

You can create a wide range of other possible reports in Easy Insight beyond simple lists. If you click on the List button in the report editor, it will pull up the list of possible reports you can use:

Examples of what you might create include:

For more information on report types, see Report Types.

For more information on filtering, see Filter Basics.

Easy Insight has rich capabilities around creating custom calculations. Custom calculations might include:

  • Gross or net margin percentages
  • If you sell clothes with a different SKU per size, you could create a custom field stripping out the size code from the SKU and reporting on sales across sizes
  • Calculate durations between two dates, like purchase order date and purchase order fully received at
  • Calculate days of stock based on average sales demand per day
  • Calculate the buildable quantity of a SKU based on current availability levels of its components

For more information on creating custom fields, see Scripting.

RESOURCES
Twitter Logo