You can use script filters to allow the user apply different scripts to your reports based on what's chosen. Here are some examples:
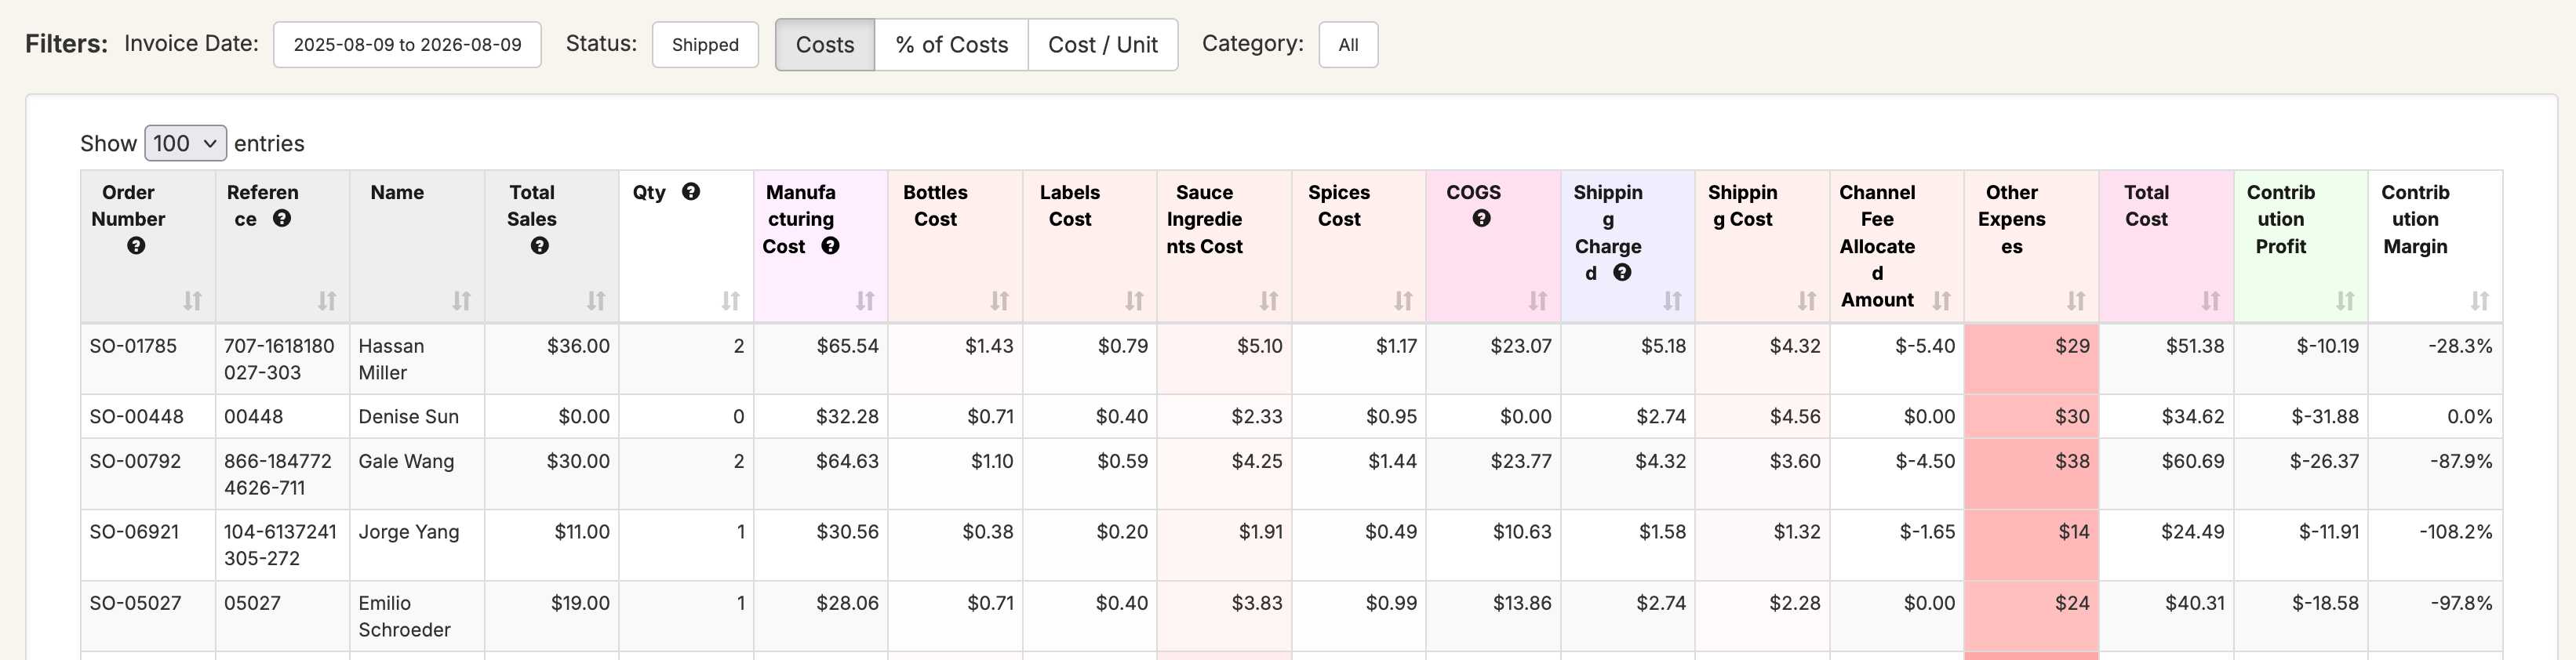
For example, the cost analysis report shown below displays the cost per order, broken out across direct items, manufacturing cost, components, shipping, channel fees, and marketing:
We can use a script filter to allow the user to toggle between the cost values, the % of cost for each row, and the cost per unit. First, create your script filter by doing Create Filter -> Advanced Options -> Create a Script Filter:
We'll go ahead and do Add Script Option three times. First, we'll set up a do nothing option labeled as 'Cost Totals'--this will show the cost values without any adjustments:
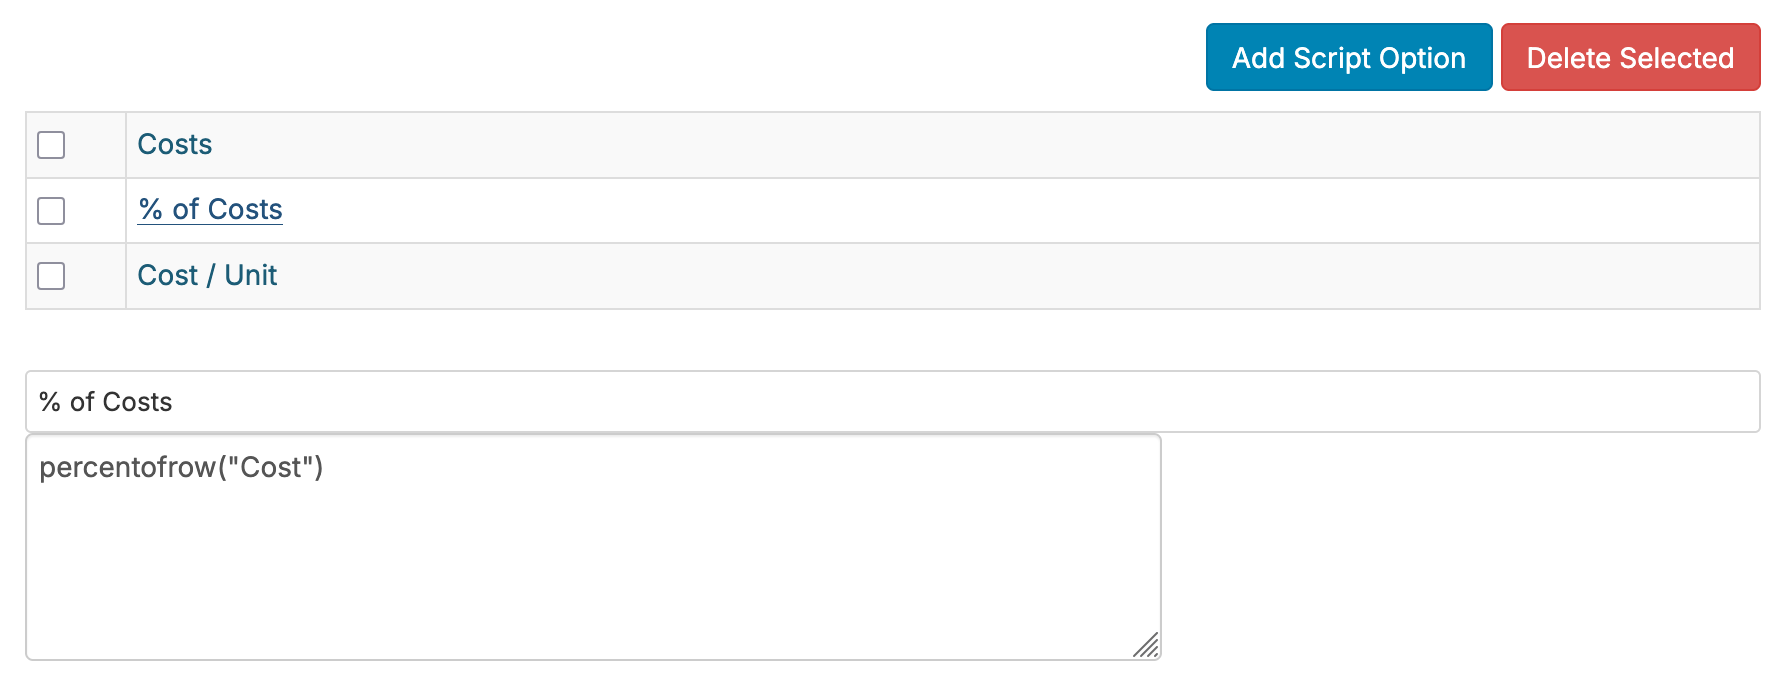
Next, we'll set up the % of cost option. For this, we'll use the 'percentofrow' function as shown below. This function takes all fields in the report which have been set with the specified Segment and calculates the % of total across the row. You can set the Segment through editing the field:
Finally, we'll set the cost per unit option. For this, we'll use the 'percentofrowbyunit' function as shown below. This function needs some of quantity unit to calculate a cost per quantity. In this case, we're using the unit quantity, but if you're converting your unit quantity to cases, pallets, cans, etc, you could use that quantity field instead:
With the options set, the report now enables the user to toggle between costs, % of cost, and cost / unit:
Next, let's do the example of highlighting based on day range. We'll do the same thing, but with the following conditions:
In the same way, users can now toggle between the different ranges and highlight different orders based on their selection.