There are two different ways that companies calculate sell through rate:
In the first approach, your inventory sell through rate shows the amount of inventory sold within a period, calculated relative to the amount of inventory you had at the start of that period. Sell through rate is most often calculated on a monthly basis.
The inventory sell through rate illustrates how quickly you are selling your products. A rate of 50% means that you sold half the units that you had at the start of the month.
Looking at the sell through rate over time is often very useful. If the rate is steadily increasing, then your sales are improving. But if the sell through rate increases too fast then your inventory levels will decline and you risk running out of stock.
Products with a low sell through rate are selling slowly. You might need to reduce prices or add targeted marketing to boost sales, or reduce reorder quantities to ensure you don't build up excess stock.
Products with a high sell through rate are selling quickly. That’s good, but if sales get ahead of restocking then your inventory levels will start falling. This might be intentional, to improve inventory turnover and reduce the amount of capital tied up in your stock.
Sell Through Rate = Units Sold / Beginning Inventory x 100
Units sold is the number of units that were sold during the period being analyzed.
Beginning inventory is the number of units held in inventory at the start of the same period.
As an example, Company A holds 1,000 units of Product Z at the beginning of the month, then sells 500 units over the course of the month.
Using our above formula:
Sell Through Rate = 1,000 / 500 x 100
Company A’s sell through rate for Product Z is 50%. This means that 50% of the Product Z stock was sold during the month.
For the second approach, you would calculate using an alternate formula:
Sell Through Rate = Units Sold / Units Received x 100
So for example, if Company A sells 500 units of that same Product Z, but has received 1,500 units in the time period:
Sell Through Rate = 1,000 / 1,500 x 100
Company A’s sell through rate using the second approach for Product Z is 67%. This means that 67% of the Product Z stock received was sold in the month.
A good sell through rate can vary depending on the industry and the type of product being sold. Most industries have a sell through rate of 40% to 80%, and anything above 70% can be considered good. Though higher or lower rates may be acceptable depending on the specific circumstances.
Easy Insight automates the process of calculating sell through rate so that you don't have to build your own spreadsheets and formulas. You can look at sell through rate with either approach. You can look at sell through rate across your entire business, by brand, category, or anything else, or all the way down to the SKU level, all without cumbersome spreadsheets. Once you've connected Easy Insight to your inventory management system, the prebuilt dashboard includes the following reports to help with inventory turnover:
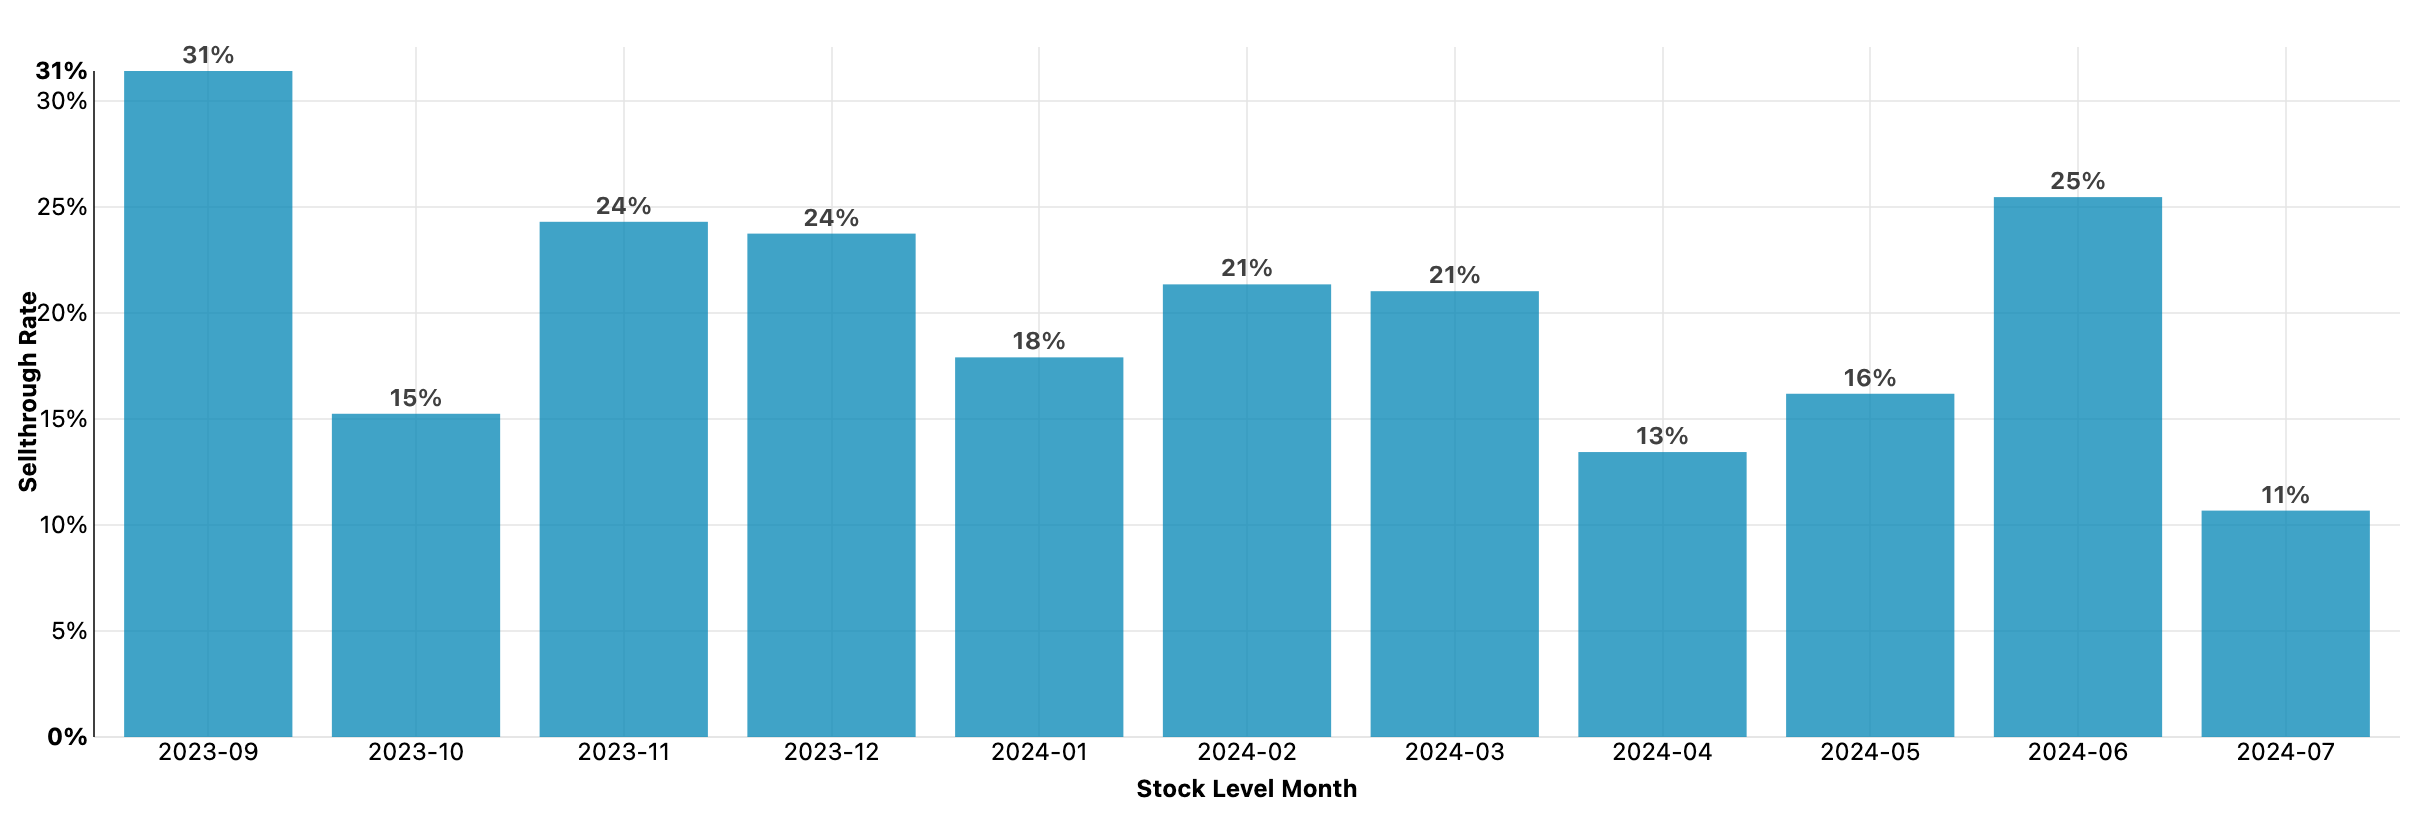
Once you've connected Easy Insight to your inventory management system, the prebuilt dashboard includes a chart of your month over month sell through rate. By default, the dashboard uses the approach of sales over opening stock quantity:
You can click on any month in the chart to dive into details about the sell through rate. You can dig into stock turn by product category, brand, or other fields.
You can also go to the Inventory Metrics section of the dashboard to see both forms of sell through rate presented in a single report, or use the fields from Inventory Level Fields in your own custom reports:
Want to learn about other inventory metrics? See Inventory Metrics for other ways to help measure and improve your business.