Your inventory turnover ratio indicates how often your inventory is sold and replaced over a specific time period, typically a year. It’s calculated based on the cost of your inventory. For example, if you sold $2,000 worth of products during the year and maintained an average inventory of $1,000, your inventory turnover ratio would be 2. This means you turned over your inventory two times within that year!
The general principle is that a higher inventory turnover ratio is preferable. It indicates that you’re consistently ordering and efficiently moving stock, rather than accumulating a large amount of inventory that takes up space and sells slowly.
Conversely, an excessively high inventory turnover ratio might not be ideal either. It could suggest that you’re ordering too frequently and allowing your stock levels to dip too low. This increases the risk of stock-outs, which lead to lost revenue.
Inventory Turnover Ratio = COGS / Average Inventory Value
COGS (Cost of Goods Sold) is the total cost of the products sold in the time period. This cost includes the purchase price of items, the manufacturing cost of building products, and the cost of delivery for purchases. Your inventory management system can help you to accurately COGS for a time period.
Average Inventory Value is the average cost of inventory over a time period. At the simplest, you can calculate average inventory value by taking the average of the stock value at the start of the time period and at the end of the time period. For a more accurate reflection of average inventory value, you can also take the monthly average of inventory value across the time period.
As an example, Company A made sales of $1.2 million last year, and the total amount they paid to get those items into stock was $400,000. Alpha’s cost of goods in inventory was $120,000 at the beginning of the year, and $80,000 at the end of the year, giving an average inventory value of $100,000.
Using the formula we provided:
Inventory turnover ratio = $400,000 / $100,000 = 4
Therefore Company A’s inventory turnover ratio for the year was four. The business turned over its inventory four times.
The ideal inventory turnover ratio varies based on your specific business and inventory strategy. Some manufacturing companies have complicated supply chains, sourcing components from various suppliers worldwide, which must then be combined and packaged into the final product. Meanwhile, other e-commerce businesses may have highly unpredictable sales from month to month. Use stock turnover in combination with other metrics to effectively manage your inventory.
Easy Insight automates the process of calculating inventory turnover so that you don't have to build your own cumbersome, manual spreadsheets. You can look at inventory turnover across your entire business, by brand, category, or anything else, or all the way down to the SKU level, all without cumbersome spreadsheets. Once you've connected Easy Insight to your inventory management system, the prebuilt dashboard includes the following reports to help with inventory turnover:
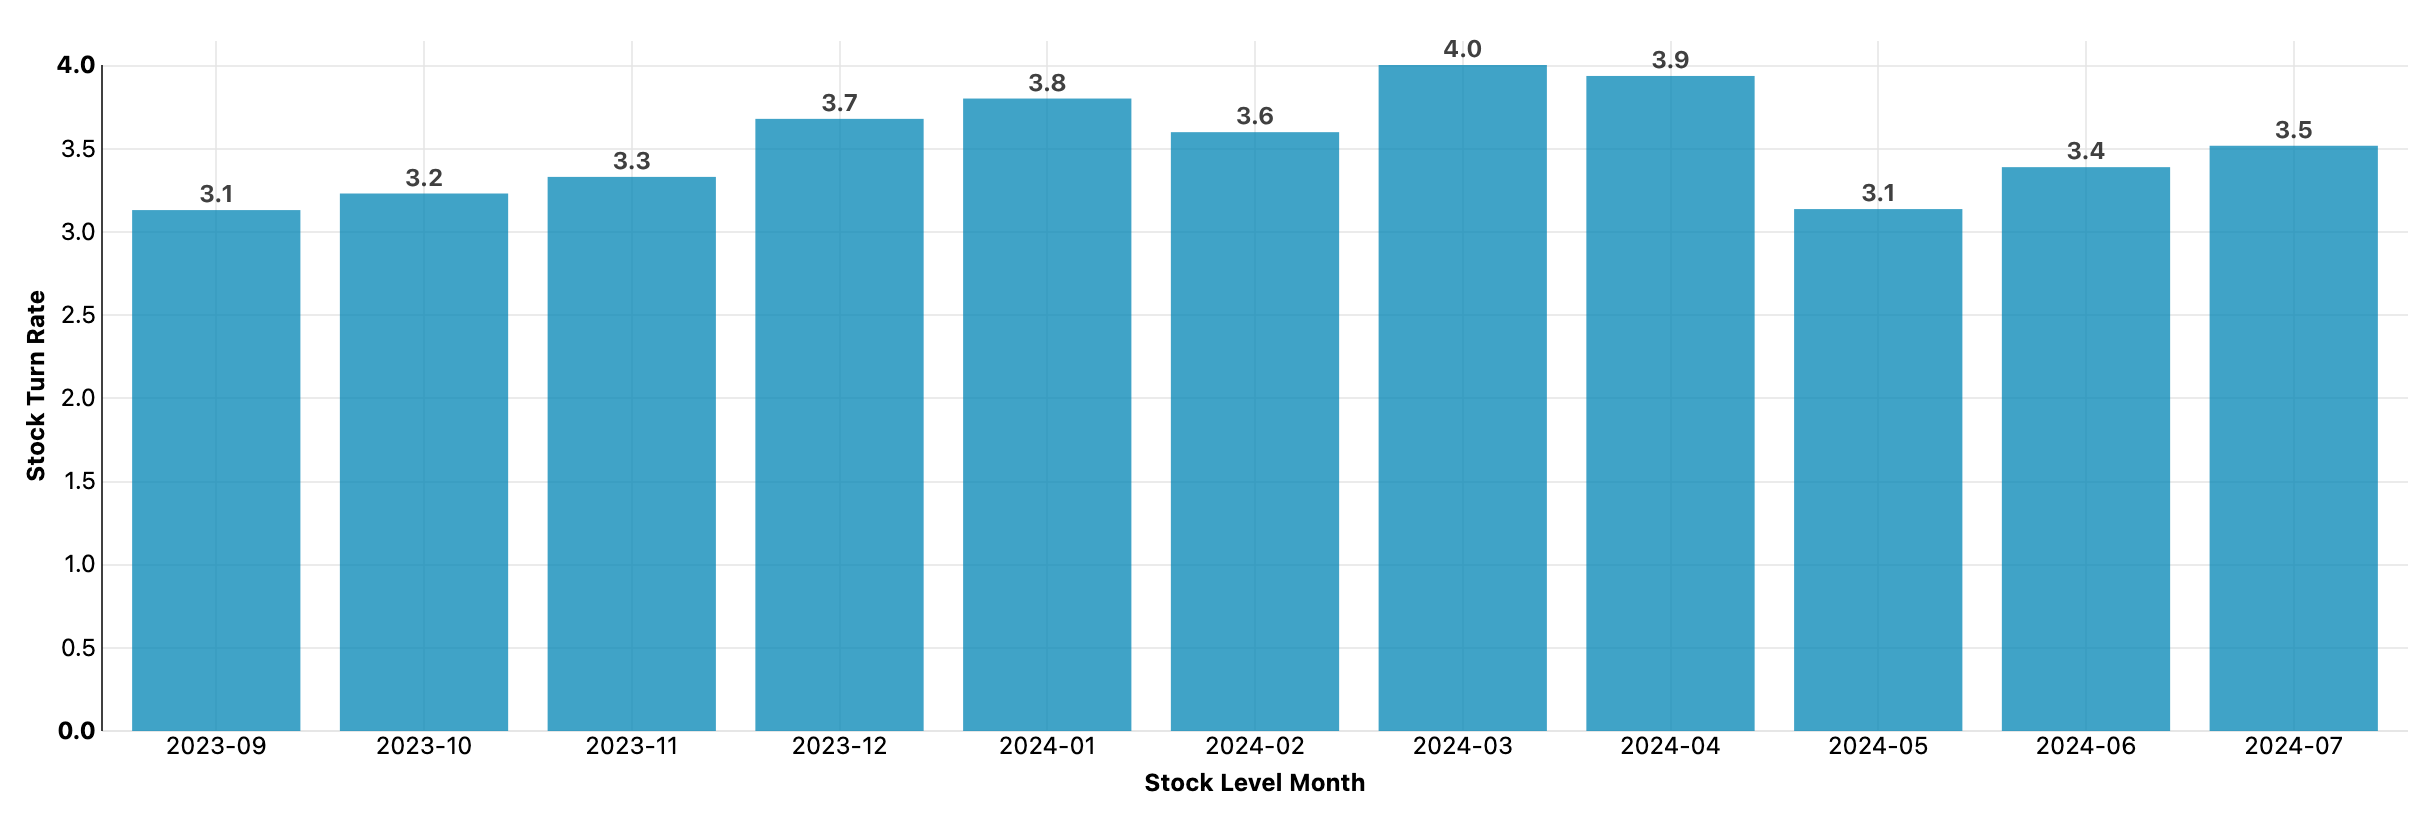
Once you've connected Easy Insight to your inventory management system, the prebuilt dashboard includes a chart of your month over month stock turn rate:
You can click on any month in the chart to dive into details about the stock turn rate. You can dig into stock turn by product category, brand, or other fields.
You can also go to the Inventory Metrics section of the dashboard to look at stock turn in more depth, as well as average inventory value:
Want to learn about other inventory metrics? See Metrics for other ways to help measure and improve your business.